How to read the stock market — systematically, not by gut feel
Oliver Sparing
Founder & Head of Trading · TradeNeon
Updated October 2026 · 6 min read · 4.9 ★ Trustpilot
Seven in the morning, thirty open tabs, and still no clear picture? A consistent morning routine helps you organize information. Using Market Radar as an example, we explain how to assess the U.S. stock market systematically and where this type of analysis has its limits.
A market signal light between two chart panels makes the market state visible at a glance.Image: TradeNeon
Read the market with a consistent routine.
Four common pitfalls and a structured market overview.
You are preparing for your trading day. Charts, news and newsletters are open in front of you. But which information matters for your decision? A fixed sequence helps you compare market conditions with previous days instead of moving from one headline to the next.
15
indicators across four dimensions of the market
4 groups
Volatility · Trend · Fundamentals · Futures curve
1 overview
Context on the U.S. stock market to support your analysis
Definition
A morning analysis is a systematic assessment before you trade: you review selected indicators in a fixed order and record what has changed. This provides context for your decisions. It replaces neither a trading strategy nor your risk management.
01
Four pitfalls in market analysis
Alongside market risks, time pressure, expectations and emotions also influence your decisions. An unstructured analysis can leave you exposed to these four pitfalls:
Confirmation bias. You favor information that supports your existing view and give too little weight to evidence against it. This tendency is called confirmation bias.
Recency bias. Recent events can influence your assessment more than the evidence warrants. A single losing or winning day can distort your view of the longer-term picture.
Information overload. Multiple sources are useful only if you can put them in context. Conflicting or duplicated information can make decisions harder.
Inconsistency. If you use different criteria every day, your assessments become difficult to compare.
A consistent routine can help you notice these biases. Review the same criteria, actively look for opposing evidence and record your assessment. This does not automatically eliminate thinking errors. Read more about how emotions influence your decisions in our article on trading psychology.
02
A market snapshot, not a signal
Market Radar does not tell you whether to go long or short today. It combines different market data into an overall assessment. Its focus is the U.S. stock market, including the S&P 500, its market breadth and U.S. volatility data. Individual stocks and other equity markets can behave differently.
Check the displayed data timestamp before interpreting the results. The indicators update at different intervals; this overview is not a real-time guide to your next entry. The time you need for the analysis depends on your experience and the questions you still need to resolve.
03
How Market Radar is built
Market Radar combines fifteen indicators in four groups, bringing together different perspectives on the market. Some of these measures are related, so fifteen indicators do not provide fifteen independent confirmations.
The fifteen indicators sit in four groups:
Volatility — including expected price fluctuations. One example is the VIXThe VIX derives the market’s expected volatility over the next 30 days from prices of options on the S&P 500.. It measures expected fluctuations over the next 30 days, not price direction.
Trend — which way the market is moving and how broad the move is.
Fundamentals — the dashboard’s name for the group covering seasonality, sentiment, bonds, the U.S. dollar, financing conditions and the yield curve. It is not an assessment of financial statements or company valuations.
Futures curve — this group evaluates the VIX futures term structure. It shows current prices for different maturities and provides context on the volatility market. It does not predict where stock prices will be in the future.
Each indicator is assigned to one of seven signal-light states. Volatility and Trend each account for 30 percent of the overall score; Fundamentals and the Futures curve each account for 20 percent. Together, they form Market Radar. Read the overall score alongside the displayed classification, which ranges from strongly bearish through neutral to strongly bullish. These are assessments within this model, not probabilities of prices rising or falling. Oliver Sparing explains how individual indicators work, from volatilityVolatility describes how much the price of a market or security fluctuates over a given period. to the futures curveIf the prices of the different futures months are plotted one after another, starting with the contract that expires next, the result is the futures curve, also called the term structure curve., in this German-language podcast episode.
04
How to use Market Radar
Three practical points:
Start with the overall reading. Check the data timestamp, overall score and classification. Compare them with previous days, then examine the individual groups. The score alone does not justify a trade.
Look for clusters. Several similar readings may indicate a broader change. But check whether the indicators measure similar data. A single conflicting reading is not automatically meaningless, and several red readings do not prove that prices will fall.
An addition, not a replacement. Combine the market overview with your trading strategy. Entries, exits and position sizing need their own rules. The signal-light color does not determine your risk budget.
Record your assessment regularly and compare it later with what actually happened. Also note when the model did not fit your market or strategy. This helps you evaluate how useful the routine is for your decisions. Learn more about our approach in the Swing Trading programme (in German).
Frequently asked questions
What is a morning analysis in trading?
A morning analysis is a systematic assessment before you trade. You review selected indicators in a fixed order and record changes. It provides context for your decisions and replaces neither a trading strategy nor your risk management.
Is Market Radar a buy or sell signal?
No. Market Radar combines market data, with a focus on U.S. equities, into a model-based assessment. It does not predict certain price movements or determine your entry, exit or position size.
Is the morning analysis free?
Yes. Market Radar is publicly available on tradeneon.com at no cost and without registration. A good market snapshot should be available to everyone, not only professionals with expensive terminals.
Who is the morning analysis for?
Day traders and swing traders who want a structured assessment of the U.S. stock market. Individual stocks and other markets require additional analysis. The overview is not a real-time tool for your next entry.
See the morning analysis for yourself
Market Radar is public and free: a daily snapshot of the stock market, with no registration required.
Oliver Sparing has been actively trading the financial markets since 2011. His professional roots lie in precious metals trading in Hamburg; in 2017 he learned at a London trading floor. At TradeNeon he leads the day trading and swing trading programmes and is responsible for the trading methodology, with a focus on order flow, market structure and fundamental market data. Level of Interest, Futures Insights and Lab of Trades grew out of this work. Platforms such as ATAS, Bookmap and WH SelfInvest regularly invite him as a guest. All guest appearances
This article explains what swing trading involves, why it can fit alongside a job, how much time and capital it needs, and which strategies TradeNeon teaches. The swing trading programme allows around 30 minutes for the daily trading routine; learning takes additional time. The programme is currently offered in German.
A daily routine gives the market a place in your schedule.Image: TradeNeon
Your trades run while you live your day.
Swing trading alongside work, with a defined daily routine.
After a long day at work, at university or in training, you come home. You briefly open the markets and immediately find yourself drawn in again.
Then the thought arrives: “Surely I don't have time for this.” Trading means extensive research, constant focus and endless screen time, doesn't it?
Many people imagine trading as a full-time occupation, with hours spent studying charts and anxiously clicking. It is understandable that it can seem out of reach when you have a job.
There is another way to approach it. Trading need not be frantic when you choose a suitable method. One discipline in particular relies on planning, patience and structure rather than constant presence: swing trading.
01
What swing trading means
Swing trading is a form of trading in which positions are held for several days or even weeks. The aim is to take part in medium-term price movements, the “swings” in a market.
Unlike day trading, where trades are often closed within minutes, swing trading seeks to trade larger market phases: moves that develop over several days and may show a clearer structure.
This can make the routine more predictable with less screen time. Swing traders do not watch the market constantly. They look for setups with a suitable risk–reward ratioThe potential gain compared with the planned loss on a trade. A potential gain of USD 100 against a planned loss of USD 50 gives a ratio of 2:1; it says nothing about the chance of either outcome.. Decisions are often made outside trading hours, in the evening or at weekends.
Swing traders often analyse four-hour or daily charts. Their analysis uses many of the same principles as short-term trading, but over a longer horizon. Support and resistance, trend lines and Fibonacci retracements can all play a part.
There are often fewer signals. Some swing traders take only a few positions a week, others only a handful a month. The sensible number depends on the system and market conditions; careful preparation does not replace risk control.
Here is a brief comparison to make the difference clearer:
Criterion
Day Trading
Swing Trading
Holding period
Minutes to hours
Days to weeks
Analysis interval
One to 15 minutes
Four-hour to daily chart
Trading frequency
Several trades per day
Fewer trades per week
Managing open positions
During the trading session
At defined daily times
Swing trading is not a compromise between day trading and investing; it is a discipline in its own right. It combines analysis with strategic patience. It can suit people with jobs when the daily routine and the risk fit their lives.
02
How it fits around a job
Many swing traders follow a weekly rhythm. They often do their main analysis at the weekend: selecting markets, preparing setups and setting alerts. During the week, they put their plan into practice and check whether positions need attention.
That is what can make swing trading workable alongside everyday life. The market continues while you do other things. You check your positions at defined times instead of intervening constantly, while retaining responsibility for the risk.
There can also be a psychological advantage. Watching fewer price changes may give you more distance from each move and help you avoid impulsive decisions. Patience and discipline are still required.
Swing trading uses less screen time than day trading, but it requires the same care with analysis, position size and risk.
The discipline lies in preparing well, rather than being present at every moment. Trading needs to fit into your life, rather than the other way around.
03
Time, capital and returns
The current TradeNeon swing trading programme gives concrete figures for its six systems. The programme itself is currently offered in German.
Daily routine
30 min
for all six systems; learning time comes on top
Starting capital
EUR 3,000
for stock systems; options systems from EUR 10,000
Returns
10–40 %
an ambitious annual-average orientation after the learning year, never a promise
Time. TradeNeon budgets about 30 minutes per day for the routine across its six systems. A single system may take less. During the first months, videos, practice, live sessions and learning the software add time. The half-hour figure is not the total time needed to learn trading.
Capital. TradeNeon states starting capital of EUR 3,000 for the stock systems and EUR 10,000 for the options systems. That capital must not be needed for living costs. You still set a position size and loss limit for every trade.
Returns. TradeNeon describes 10–40% average annual return as an ambitious orientation from its practice for well-trained traders after the learning year, applying tested systems and risk rules consistently. It is not a forecast for an individual reader. Losses, including loss years, are possible. The first year is for learning without a return expectation. See the real-money performance and its context.
Keep the numbers in context
Results depend on the system, market conditions and execution. Neither a historical result nor a risk rule guarantees a future return.
04
Approaches used in swing trading
Swing trading involves recognising recurring market structures and using them systematically. The aim is to check selected setups against defined rules, rather than catch every move. A system should specify the entry, exit and risk before a trade is placed. Even a well-founded trade can lose.
TradeNeon continues to develop approaches for different market mechanisms. The following examples cover commodity data, Fibonacci zones, options and stock momentum. They represent different disciplines; none is profitable in every market phase.
Trading commodities: how positioning data can reveal trends
Commodity markets rarely move without a reason. Changes in the behaviour of large market participants can be behind major price moves. TradeNeon's commodity system combines fundamental data with chart analysis.
What counts as fundamental data? We examine several kinds of information:
CoT dataWeekly aggregated positioning reports published by the US Commodity Futures Trading Commission from positions reported by firms. They describe positioning, not a stand-alone entry signal.: reported positions, grouped and published by the CFTC.
Seasonality: recurring patterns at certain times of the year.
Futures curvesThe prices of futures contracts for the same underlying market across different expiry months.: prices for different contract months in the same market.
Market dynamics: how prices develop as conditions change.
When large market participants change their positions, CoT data may reveal a shift. We observe these changes and look for confirmation in the chart before a setup becomes relevant.
Our aim is to assess medium-term moves in liquid commodity markets such as gold, oil and copper according to the system's rules and, where appropriate, take part in them.
In the training programme we use Futures Insights to prepare CoT data, seasonality and other market information for analysis. The trader interprets the data and makes the trading decision.
The CFTC publishes CoT reports on reportable futures positions. They show positioning, but are not an entry signal by themselves.
Fibonacci system: finding structure in a market move
Trends rarely move in a straight line. A move can be followed by a correction. Some systems look for an entry there, but a retracement cannot guarantee that the trend will continue.
How do we identify a potential reversal zone? We combine classic Fibonacci retracements with supply and demand. The volume profile is an important part of that analysis: it shows where trading activity was concentrated and which price areas may matter.
When price and volume tell a coherent story, a possible zone for trend continuation can become visible. Any position still follows a defined risk and exit rule.
The point is to assess market structure instead of reacting to a line drawn on the chart alone. Corrections can create opportunities, but the setup can fail.
Historical chart example. Silver futures on a four-hour chart with Fibonacci zones, a volume profile and moving-average lines; not a current trade recommendation.
Options: understanding premiums and risk
Options strategies can consider volatility, trend and fundamental data. An option premium is not predictable profit: market moves, time to expiry and execution can all lead to losses.
For example, an optionA time-limited contract: the buyer acquires a right for a premium, while the seller takes on a contractual obligation. The two sides carry different risks. can refer to a broad stock index such as the S&P 500. Before entry, we assess market conditions and set the risk and exit rules.
Time-value decay can be one part of a sold-options strategy. Collecting a premium does not automatically limit the possible loss.
A rule-based system defines when a position is opened, adjusted or closed. Loss phases are possible even with such rules.
Current offer
The Lab of Trades currently describes the Opening Put in its Argon options module. Its availability and rules are on the product page. An option premium is never a guaranteed return.
Stock momentum: identifying strength and following trends
MomentumThe tendency for a price move to continue for a time. It can reverse and is not a prediction by itself. is central to this approach. Many investors think of the stock market like a supermarket: buy as cheaply as possible and wait for a higher price.
Stocks are not consumer goods, however. Their value does not depend on how cheap they appear. Buying a falling stock is a bet on a reversal, yet there are often reasons for the low price. A lower price alone does not make a share attractive, just as a recent rise cannot guarantee further gains.
Rising prices can signal strength. TradeNeon's stock-momentum system looks for shares outperforming the wider market and assesses whether that strength offers a setup within its rules.
Several indicators check whether a move fits the system or looks more like a short-lived excess. A share becomes interesting only when trend, momentum and market conditions align. Even then, the move can end.
The idea is to measure relative strength and trade by fixed rules while it persists. The system includes an exit when momentum weakens, though a timely exit is never guaranteed.
05
The practical conclusion
Swing trading is neither half-hearted trading nor a shortcut to quick success. It is a considered way to understand markets and act with structure. Learning it shows how much depends on preparation, patience and careful execution rather than constant activity.
A fixed daily routine can be helpful for people with jobs. You can plan decisions and check positions at set times; market risk remains between those checks.
With experience, you can assess your process better and put individual results into perspective. Whether that produces a long-term profit also depends on market conditions and consistent risk management.
That brings us to the end. Thank you for reading, and I wish you good trades.
Until next time, Simon
Frequently asked questions
What is swing trading?
It is an approach that typically holds positions for days or weeks to take part in medium-term market moves. The holding period does not remove market risk.
Can I swing trade alongside a job?
It can fit around work if you can follow a defined daily routine and give decisions your attention. TradeNeon budgets about 30 minutes per day for its six systems, with extra learning time during the programme.
How much capital do I need?
TradeNeon states starting capital of EUR 3,000 for its stock systems and EUR 10,000 for its options systems. Use only capital you can afford to lose.
What returns can I expect?
Do not treat a published range as a personal expectation. TradeNeon's 10–40% annual-average range is an ambitious orientation for trained traders after the learning year, not a guarantee. Losses remain possible.
What is different from day trading?
Day trading generally closes trades within one session and requires attention during that session. Swing trading holds positions longer and uses planned checks, while accepting overnight exposure.
Check the market context
Market Radar brings 15 indicators into one view of the broader stock-market environment. Use it to inform your own analysis, not as a trading signal.
Swing TradingTrading alongside workRisk managementOptionsFibonacciCoT data
Simon Reichert
Swing trading coach · TradeNeon
Simon Reichert is a swing trading coach at TradeNeon. He studied International Business Management, worked in finance and auditing, and has traded actively since 2022. His focus is swing trading, the broader market context and risk management.
Who holds long and short positions in the futures market? The weekly Commitments of Traders report offers a partial view. It reveals neither any individual trader's motive nor the next price move. Read in context, it can help you understand positioning and the wider market.
The figures represent trader groups; the tiles represent their reported positions.Image: TradeNeon
See positioning. Understand context.
What the COT report shows, what it leaves out and how to read it.
Imagine playing poker and finding out afterwards how different groups bet, without seeing any individual player's cards. CoT data offer a similarly limited view: they show past, aggregated positions of reportable trader groups. This article explains who those groups are, how to compare their positions over time, and why that comparison alone is not an entry signal.
01
What are CoT data?
Before going deeper, let's clarify the basics: what are CoT data, and why might you consider them in trading? The CoT reportsWeekly CFTC reports on the open positions of different trader groups as of the preceding Tuesday. were not invented by trading gurus. They are published by the Commodity Futures Trading Commission (CFTC), the US regulator for derivatives markets where, among other instruments, futuresStandardised contracts on an underlying asset with a specified size and expiry. are traded.
The aim is transparency. The CFTC's predecessor began publishing monthly CoT reports in 1962, showing how different groups of market participants were positioned in US futures markets. The first monthly report covered 13 agricultural commodities. The CFTC later continued the series; the reports have appeared weekly since 2000.
Today, the reports cover numerous markets, from gold and crude oil to financial futures. The CFTC normally publishes them on Fridays at 3:30 p.m. US Eastern Time, using positions from the preceding Tuesday; holidays can shift the release. This is not a live data stream, but it consists of reported figures rather than estimates. You see more than the fact that gold's price rose: you see how reported trader groups were positioned. Individual traders and their intentions are not disclosed.
02
Who appears in the CoT report, and what can their positions tell us?
To understand CoT data, distinguish between trader groups. A commodity producer may hedge price risk; a fund may follow another strategy. There are also several CoT report formats.
The groups in the Legacy CoT report
Originally, the report now called the Legacy format was the only CoT report. It broadly divides participants into three groups:
Commercials
Large participants with a hedging interest, such as producers, merchants and processors.
Non-Commercials
Large investors with speculative trading intentions, such as hedge funds.
Non-Reportables
The remaining participants whose positions are part of the market but fall below the reporting threshold.
Why the Disaggregated Report exists
In the Legacy report, physical merchants and financial institutions can appear together as Commercials. For example, a bank hedging an index fund's oil exposure through futures may appear alongside oil companies. In 2009, the CFTC introduced the Disaggregated Report, which separates reportable traders more finely by their predominant business activity. The Legacy report remains available.
The groups in the Disaggregated CoT report
The main groups in the Disaggregated report are:
Producer / Merchant / Processor / User (PMPU)
This group mainly comprises companies whose primary business is connected to the physical commodity market, such as mining companies, agricultural producers and food businesses. They mainly use futures to hedgeTo limit a price risk with an offsetting position; a hedge does not eliminate every risk. business risks. A wheat producer, for example, may sell futures to protect against a fall in crop prices. A large bakery may buy futures to limit its purchase price risk.
PMPU traders can therefore be identified more clearly as a group with a physical business connection. Unlike in the Legacy report, Swap Dealers are not included in this category. That makes the group easier for traders to interpret.
These participants know their industries well. An unusual position can therefore be a clue to their risks and market environment. It does not show whether every position is a hedge, whether PMPU traders think the price is cheap, or whether prices will rise over the medium to long term.
Even within this group, however, the boundaries can blur. Some PMPU traders may use their market knowledge speculatively as well. That does not erase the value of the category, but it does qualify what we can infer from it.
Managed Money
Managed Money includes investment funds, hedge funds and asset managers, for example. The CFTC classifies traders by their predominant business activity. The category alone reveals neither the motive for every position nor a reliable forecast. Changes in this group's positions can still be useful to examine. Their holdings may follow a trend. Common, but by no means inevitable, patterns include:
Long positions may increase in rising markets
Short positions may increase in falling markets
That can make their movements easier to follow. Depending on the market, changes in their positions may reinforce a trend or provide a warning sign.
Swap Dealers
Swap Dealers trade swaps and other derivatives, including for clients. Their hedges may appear as futures positions in the report. The Disaggregated Report separates them from producers, merchants and processors. Their reported futures position reveals neither the risk of their full book nor their clients' motives.
Other Reportables
This is a mixed group of larger reportable participants who do not fall under Managed Money—for example, family offices or very well funded private investors. Their strategies differ, making them harder to interpret. At times they may act like speculators, at other times like hedgers.
Non-Reportables
This is the calculated residual for positions held by traders below the reporting threshold. The report does not tell us how many are private traders. Their share of open interestThe number of futures or options contracts still open; it is not daily trading volume. varies by market and reporting date.
03
How should you analyse CoT data?
A net position says little on its own. A comparison with earlier reports shows whether a group was unusually positioned. Two hundred thousand net short contracts may be ordinary in one market and remarkable in another. You need a historical series to judge the difference.
Analysing CoT data manually or with software
If you enjoy working with tables and do not mind updating data regularly, you can go straight to the source. The CFTC offers a free CoT data environment. You can filter reports by market and period and export data; HTML reports and historical files are also available.
The catch is that the reports are extensive. If we open the Disaggregated Futures Only report for the Agriculture sector as an HTML page, we get a view like this:
WHEAT-SRW - CHICAGO BOARD OF TRADE                                                                                                               Code-001602
Disaggregated Commitments of Traders - Futures Only, May 20, 2025
-------------------------------------------------------------------------------------------------------------------------------------------------------------
     :          :                                              Reportable Positions                                                      :   Nonreportable
     :          :  Producer/Merchant/ :                                :                                :                                :     Positions
     :   Open   :   Processor/User    :          Swap Dealers          :         Managed Money          :       Other Reportables        :
     : Interest :   Long   :  Short   :   Long   :  Short   :Spreading :   Long   :  Short   :Spreading :   Long   :  Short   :Spreading :   Long  :  Short
-------------------------------------------------------------------------------------------------------------------------------------------------------------
     :          :(CONTRACTS OF 5,000 BUSHELS)                                                                                            :
     :          :    Positions                                                                                                           :
All  :   478,028:    90,281     55,748     70,078      5,531     20,498     93,184    193,725    111,715     34,517     33,602     22,615:   35,140    34,594
Old  :   470,119:    88,187     53,760     69,739      5,792     20,017     91,913    194,524    109,879     36,381     33,179     19,513:   34,490    33,455
Other:     7,909:     2,094      1,988        816        216          4      3,107      1,037          0        184      2,471      1,054:      650     1,139
     :          :                                                                                                                        :
     :          :    Changes in Commitments from:       May 13, 2025                                                                     :
     :    -3,459:    -5,953      6,044     -1,238        161      1,837      5,063    -14,937      6,035     -3,368     -1,842     -1,664:   -4,171       907
     :          :                                                                                                                        :
     :          :    Percent of Open Interest Represented by Each Category of Trader                                                     :
All  :     100.0:      18.9       11.7       14.7        1.2        4.3       19.5       40.5       23.4        7.2        7.0        4.7:      7.4       7.2
Old  :     100.0:      18.8       11.4       14.8        1.2        4.3       19.6       41.4       23.4        7.7        7.1        4.2:      7.3       7.1
Other:     100.0:      26.5       25.1       10.3        2.7        0.1       39.3       13.1        0.0        2.3       31.2       13.3:      8.2      14.4
     :          :                                                                                                                        :
     :          :    Number of Traders in Each Category                                                                                  :
All  :       370:        84         67         23          7         14         51         80         69         55         43         40:
Old  :       370:        84         66         23          7         14         51         80         67         56         41         40:
Other:        71:        14         25          5          .          .          8          7          0          .         11          9:
     :-------------------------------------------------------------------------------------------------------------------------------------------------------
     :             Percent of Open Interest Held by the Indicated Number of the Largest Traders
     :                          By Gross Position                       By Net Position
     :               4 or Less Traders     8 or Less Traders     4 or Less Traders     8 or Less Traders
     :                 Long:     Short       Long      Short:      Long      Short       Long      Short
     :----------------------------------------------------------------------------------------------------
All  :                 12.3       16.5       21.1       27.4        8.9       11.6       15.0       19.9
Old  :                 12.5       16.8       21.4       27.8        9.0       11.7       15.2       20.2
Other:                 52.5       43.8       68.9       64.0       51.2       43.3       63.2       59.3
Wheat, 20 May 2025. This historical report keeps the dense original layout; scroll sideways on narrow screens. Original CFTC report
This historical report shows why working with raw data takes time: you must select the relevant trader groups and figures and compare them regularly. You can import CFTC files into a spreadsheet yourself or use software. Neither replaces your interpretation of the data.
Two ways to add historical context
Manually
Open CFTC reports, select relevant figures and keep your own overview up to date.
With software
View CoT data alongside other market data in a tool and compare historical positions.
Analysing CoT data: a 2025 example
The Academy example from June 2025 examines soybean meal (ZM). The following historical chart shows the long and short positions of Managed Money. It does not describe current market conditions.
Futures Insights view from the 2025 Academy example. The dots show historical positions, not current market conditions. Open full size.
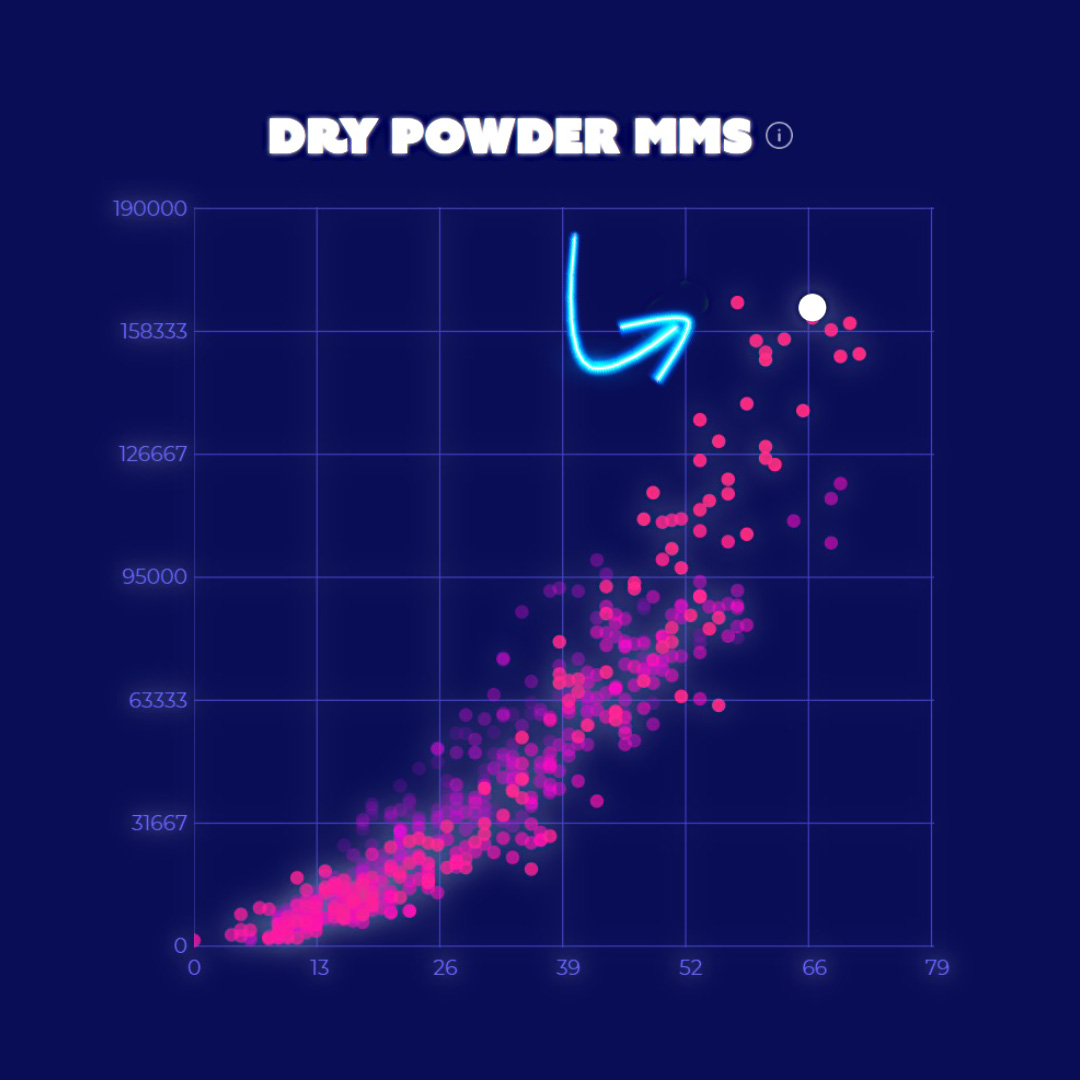
White dots mark the positions at that time; coloured dots show earlier values. In the historical comparison, the long position was unremarkable. The short side was unusually crowded. That judgement depends on past values, rather than the absolute number of contracts alone.
Looking at Managed Money's short position at that point, one thing stands out: the group was heavily short. Its short holdings grew during the downtrend shown in the historical example. The CoT report alone cannot tell us whether, or to what extent, that group moved the price.
In the historical Dry Powder MMS (Managed Money Short) image, only one short position in the ten-year period up to June 2025 contained even more short contracts.
The short extreme at the time provided useful market context. It placed no limit on new short positions and did not predict a reversal. CoT data provide clues, not certainty.
Short positioning in the 2025 Academy example. The highlighted dot does not describe the current CoT situation. Open full size.
How should you use CoT extremes?
An extreme position is no reason to enter a trade immediately. Positions can become more extreme while a trend continues. Assess the longer-term market context and wait for your own chart setup before entering.
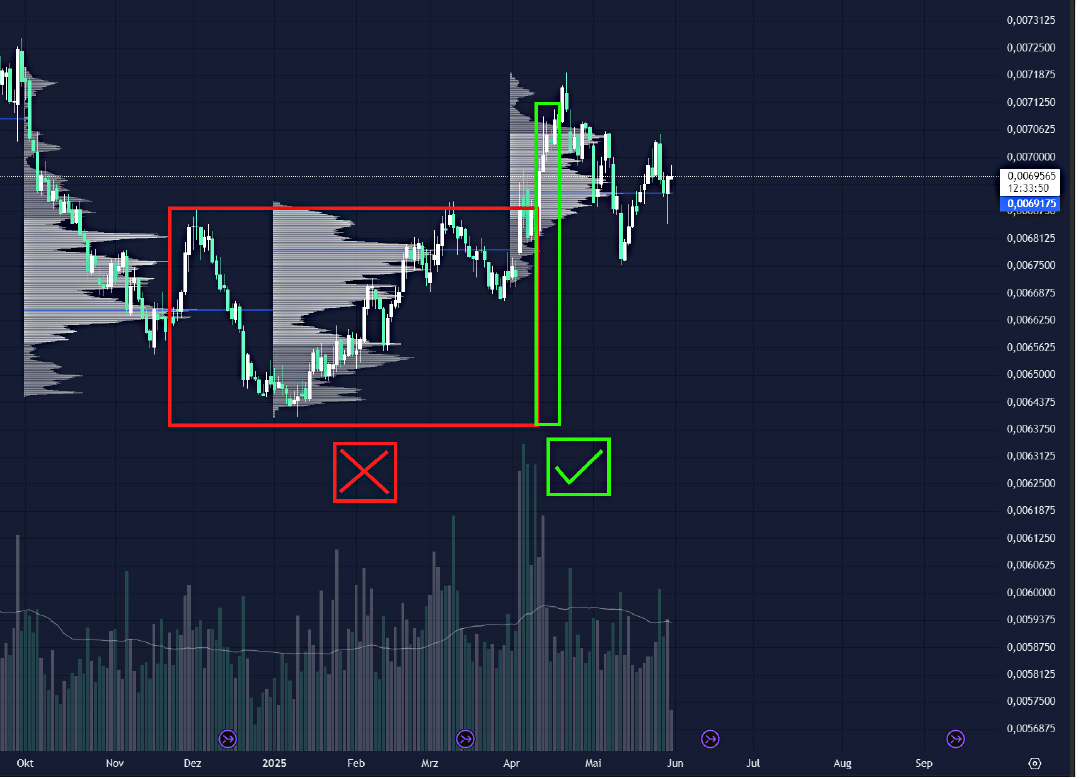
So what should you do? Once you think a long position makes sense from a fundamental perspective, the next step is chart analysis. Only when the market also offers a suitable price area and a clean setup can a CoT idea become a trade. CoT data help with the “what”; the chart helps with the “when.”
Simon's chart from the Academy article illustrates the difference between market context and entry timing. No market label is legible in the crop. Open full size.
CoT data in fundamental context
A Managed Money position alone does not describe the entire fundamental picture. Compare it with physical traders' positions, seasonal patterns, the futures curve and other market measures. Several clues can support an idea; they cannot prove the future price direction.
1. PMPU positioning
It is particularly interesting when producers, processors and other PMPU traders also reach a historical extreme. If both groups are unusually positioned, examine the market context more closely; a good trade does not automatically follow.
2. Other important fundamental influences
Seasonality: are there typical market moves at certain times of year?
The structure of the futures curveA comparison of prices for futures contracts with different expiry dates.: is there contango or backwardation, and what might that say about supply and demand?
3. Broader context
CoT positions can become more useful when you compare them with other variables:
Current price: is the market historically expensive or cheap?
Number of active participants: are there unusually many or few?
Total open interest: how many contracts are open overall?
Another view of Managed Money positions in the 2025 Academy example. This image does not show current market conditions. Open full size.
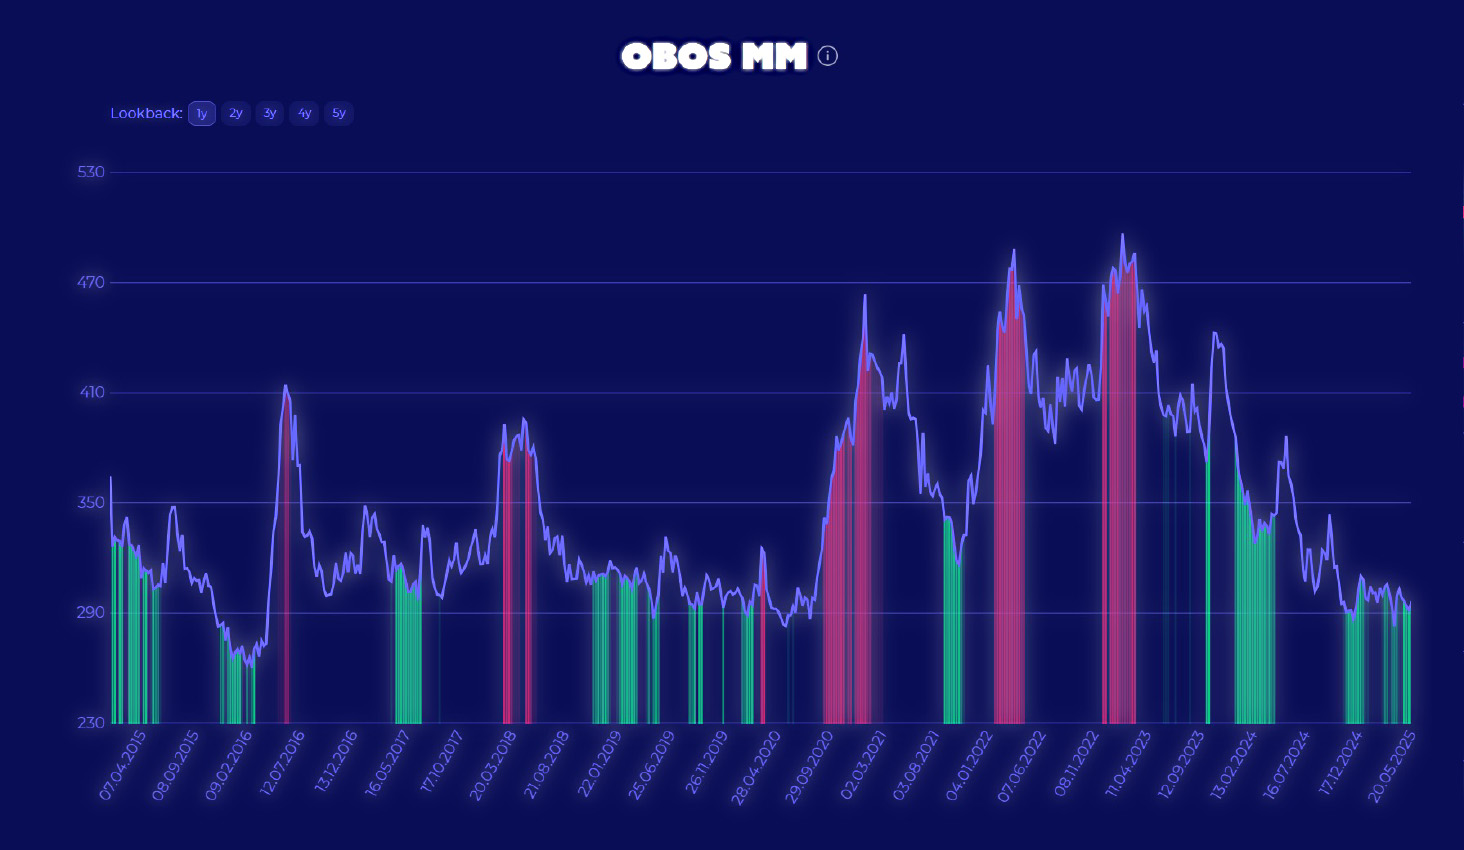
How extreme a Managed Money position appears also depends on total open interest. Compare its size with earlier positions and the market phase. The next historical image offers another view of the 2025 example; the subsequent OBOS indicator adds context.
Historical Futures Insights view up to May 2025; its design and values are not the current product or market state. Open full size.
04
Which markets are particularly suited to CoT analysis?
Not every market is equally suited to CoT analysis. Reportable physical participants, sufficient open interest and a meaningful historical comparison matter. The following criteria help you choose.
What makes a market suitable for CoT analysis?
Look for markets in which:
01
Commercial interest and physical participants
There is a clear commercial interest in hedging, and commercial participants are active in the physical commodity market.
02
High open interest
A substantial number of contracts remain open. Open interest helps put positions into perspective; a high value does not automatically make a price forecast more reliable.
03
Seasonal patterns and cycles
Historical cycles and seasonal patterns are present. Markets with a seasonal character often show recognisable positioning patterns, which can make CoT data more informative.
Markets of interest to CoT traders
Given those criteria, the following four groups of futures markets are worth examining:
Energy and metals8 markets
These commodities are tied to the physical economy. Examples include:
Market
Exchange code
Gold
GC
Silver
SI
Platinum
PL
Copper
HG
Crude oil
CL
Natural gas
NG
Heating oil
HO
Gasoline (RBOB)
RB
These markets have strong links to physical demand, sizeable commercial participants and active Managed Money positions.
Agricultural markets9 markets
Grains and soft commodities often show seasonal patterns. Examples include:
Market
Exchange code
Corn
ZC
Wheat
ZW
Soybeans
ZS
Soybean meal
ZM
Soybean oil
ZL
Cocoa
CC (ICE)
Cotton
CT (ICE)
Coffee
KC (ICE)
Sugar
SB (ICE)
You may see distinct seasonal phases and positions taken by Commercials against the prevailing price trend, such as buying around harvest lows.
Livestock markets2 markets
Market
Exchange code
Live cattle
LE
Lean hogs
HE
These markets are strongly shaped by biological production cycles. Commercial participants such as feedlots and meat processors often hedge price fluctuations, which can also produce noticeable positions depending on the market and period.
Currency markets6 markets
Market
Exchange code
Australian dollar
6A
British pound
6B
Canadian dollar
6C
Euro
6E
Japanese yen
6J
Swiss franc
6S
CoT data can also be informative here, particularly about the speculative positions of large funds. For financial futures, including currencies, the CFTC uses different trader groups in its Traders in Financial Futures report. Participants in these markets may hedge risks as well; the classification simply differs from that used for commodities.
The 26 markets in Futures Insights 2.0
Futures Insights 2.0 groups 26 futures markets into eight classes. The Free Plan gives you gold (GC) with all indicators; paid plans unlock all 26 markets.
In our swing trading programme, you learn to use CoT data, seasonality and price dynamics deliberately—with a clear, adaptable framework rather than rigid strategies.
It is aimed at people who want to understand trading thoroughly and develop their approach over time.
06
Final thoughts
CoT data show past group positions. In historical context, they can inform a market view, but they confirm neither an entry nor a future price direction. A trading decision still needs your own rules and a suitable setup.
If you want to use CoT data, seasonality and other factors in a structured process, you can learn more in our swing trading programme.
Simon and the TradeNeon Academy team
Start with the gold market
Try gold (GC) with all indicators in the Futures Insights Free Plan. When you want to analyse more markets, Futures Insights 2.0 covers 26 in total.
The regular release is Friday at 3:30 p.m. US Eastern time and describes open positions as of Tuesday. Holidays or exceptional circumstances can change the schedule.
Is COT data an entry signal?
No. It describes past group positions. Entry timing, price and risk must come from your own method.
Was the Legacy Report discontinued?
No. The CFTC still publishes both Legacy and Disaggregated reports. They group traders differently.
Does it show what a particular major trader plans to do?
No. It shows aggregated positions and categories, not the intention or strategy of an individual participant.
COT dataFuturesSwing tradingMarket analysis
Simon Reichert
Swing trading coach · TradeNeon
Simon Reichert is a swing trading coach at TradeNeon. He studied International Business Management, worked in finance and auditing, and has traded actively since 2022. His focus is swing trading, the broader market context and risk management.
Fibonacci lines express an observed price move in percentages. They can help you mark areas where a pullback may deserve attention. The sequence cannot tell you whether the market will react there. Your chosen swing, market context and risk plan still matter.
A spiral illustrates proportions; it cannot forecast the next price.Image: TradeNeon
A charting framework. Not a market oracle.
What the ratios mean – and where their limits lie.
Fibonacci sounds like a name from an old book of spells. Behind it is a number sequence that has interested mathematicians for centuries and is also used in trading.
Anyone looking at chartsVisual representations of prices over time, such as line or candlestick charts. will eventually encounter horizontal lines at 38.2% or 61.8%. They look precise and are intended to show possible pullbacks within a price move. But where do these numbers come from? And what can a line really tell you about the next trade?
This article explains how the Fibonacci sequence works, which tools have been built from it and how to use a Fibonacci retracementA Fibonacci retracement divides a selected price move between a high and low into percentage pullback levels. on a chart. The original chart examples show both the choice of a trend move and common mistakes. The mathematical ratios are clear; whether price reacts at a level is a separate question.
The main point
A Fibonacci retracement measures how far price has moved back through a selected earlier move. Its lines are areas to observe, not support levels that work automatically or trading signals on their own.
01
The Fibonacci sequence
The Fibonacci sequence begins 0, 1, 1, 2, 3, 5, 8, 13, 21. From the third term on, each number is the sum of its two predecessors: 3 + 5 = 8, followed by 5 + 8 = 13. Leonardo of Pisa, known as Fibonacci, popularised the sequence in Europe in his 1202 book “Liber Abaci”. The idea had been described earlier in India.
The number sequenceEach number grows from the two before it
Select a step
Calculation 9Fn = Fn−1 + Fn−2 · n ≥ 2
Redrawn from the values in the Academy diagram. The rising curve shows the number sequence, not a price chart.
The ratios become interesting: 3 divided by 2 is 1.5; 5 divided by 3 is about 1.667; 8 divided by 5 is 1.6, and 13 divided by 8 is 1.625. Farther along the sequence, the ratio of consecutive numbers approaches the golden ratio, about 1.618. Reverse the ratio and you obtain about 0.618. Numbers two or three positions apart produce approximately 0.382 and 0.236. That is the mathematical origin of the familiar percentage levels.
A spiral can be drawn from adjoining squares and quarter circles. Similar shapes occur in some shells and plants. The drawing illustrates proportions. It does not show that every natural spiral follows the golden ratio exactly or that market prices obey it.
New geometric construction: Fibonacci squares and quarter circles form an approximation.New shell illustration: an organic spiral for context, not proof of an exact Fibonacci ratio in nature.
02
What a retracement measures
Many traders use these ratios as a grid for corrections within a trend. A retracement tool connects a selected low and high, or the other way around, and divides the price range into percentages. After a rise from 100 to 120, a 50% pullback lies at 110; a 61.8% pullback at 107.64. These levels describe distance from the high. The calculation cannot tell you whether price will reach or reverse at either one.
23.6%Ratio from the sequence
38.2%Ratio from the sequence
50%Half the move; not a Fibonacci ratio
61.8%Reciprocal of the golden ratio
78.6%Approx. √0.618; a charting convention
50% is half the move, but is not a ratio from the Fibonacci sequence. Some traders add 75% as another round number. The 78.6% level is approximately the square root of 0.618 and has become a convention in many charting tools. So 75% and 78.6% are different; neither is automatically the “last” valid pullback before a trend breaks. Which lines a platform displays depends on its settings.
What do the lines mean in practice? In an uptrend, a 23.6% retracement describes a shallow pullback, 38.2% a larger one and 61.8% a deeper one. This tells you only how much of the selected move price has given back. It says nothing about the strength of the trend or the chance that it will continue. Change the starting point and the prices of all percentage levels change too.
Redrawn from the original diagram. The lines show distances between two selected price anchors; the prices reproduce the rounded labels in the historical screenshot.
The earlier “league system” ranked 61.8%, 38.2% and 23.6% by presumed attention. That does not establish a ranking of how prices react. Nor is there evidence that institutional traders or algorithms generally cause higher volume at these levels. A commonly watched area may be part of a market observation; its hit rate and practical value have to be tested for the market and rules in question.
Sometimes a response at a widely watched level is explained as a self-fulfilling prophecy. To support that explanation, we would need to know how many participants chose the same trend leg, settings and trading direction. Even 75% and 78.6% produce different prices. An earlier high, news or liquidity may also be nearby. A price response close to a Fibonacci line cannot, on its own, identify what caused it.
Keep mathematics and market behaviour separate
The origins of 61.8%, 38.2% and 23.6% can be calculated. The claim that these particular lines hold more often or cause reversals is an empirical one. It does not follow from the sequence.
The retracement is the central Fibonacci tool. You select a high and low on the chart; the platform draws the chosen percentage levels between them. In an uptrend, that usually means a move from low to high, and the reverse in a downtrend. You can often adjust the lines yourself. They mark areas worth watching, not entries at the press of a button.
Extensions project arithmetic levels beyond the original high or low. Common examples are 161.8%, 261.8% and 423.6%, each relative to a selected prior move. Traders use them, for example, to assess possible target areas after a breakout. An extension is not a price target with a known probability.
Fibonacci time zones transfer distances from the sequence to the time axis rather than price. They can mark windows to observe, but do not predict a turning point. One retracement is usually enough to learn the method: decide in advance which move you are measuring and why its high and low fit your approach. Move the anchors later and every line changes.
04
Assessing an area on your chart
Step 1: Identify the trend. Before drawing levels, check whether the market shows a recognisable move followed by a correction. Without a justified trend leg, almost any two highs and lows can produce a grid. Record the period and market phase you are examining.
Step 2: Connect two points. In an uptrend, draw from low to high; in a downtrend, from high to low. The original article included candle wicks when choosing the extremes. Select prominent points that were visible before the potential reaction, and check how your platform displays the percentages.
Step 3: Watch the response. As price approaches an area, you can examine price behaviour, market structure and volume. An existing support or resistance areaA price area where buying or selling was previously visible. It may matter again, but does not have to., a volume profileDisplays traded volume by price area rather than by time. It records past activity, not guaranteed future support. or order flow may add context. Higher volume at a line does not prove that the Fibonacci number caused it.
The Academy original also mentioned auction speed and order-flow signals as possible observations. They can describe current trading activity. They do not replace a rule for recognising a response: Is a touch enough, must a candle close, or should another price area confirm the move? Without that definition, the desired outcome can easily influence a later review.
Step 4: Decide how to act. Only a rule defined beforehand determines whether the observation becomes a trade: What confirms the idea, what invalidates it, where is the stop and how large may the position be? A stop orderAn order triggered when a chosen price threshold is reached. In fast markets, execution can differ from the trigger price. and appropriate position size belong in that plan. A line alone is not a confirming signal.
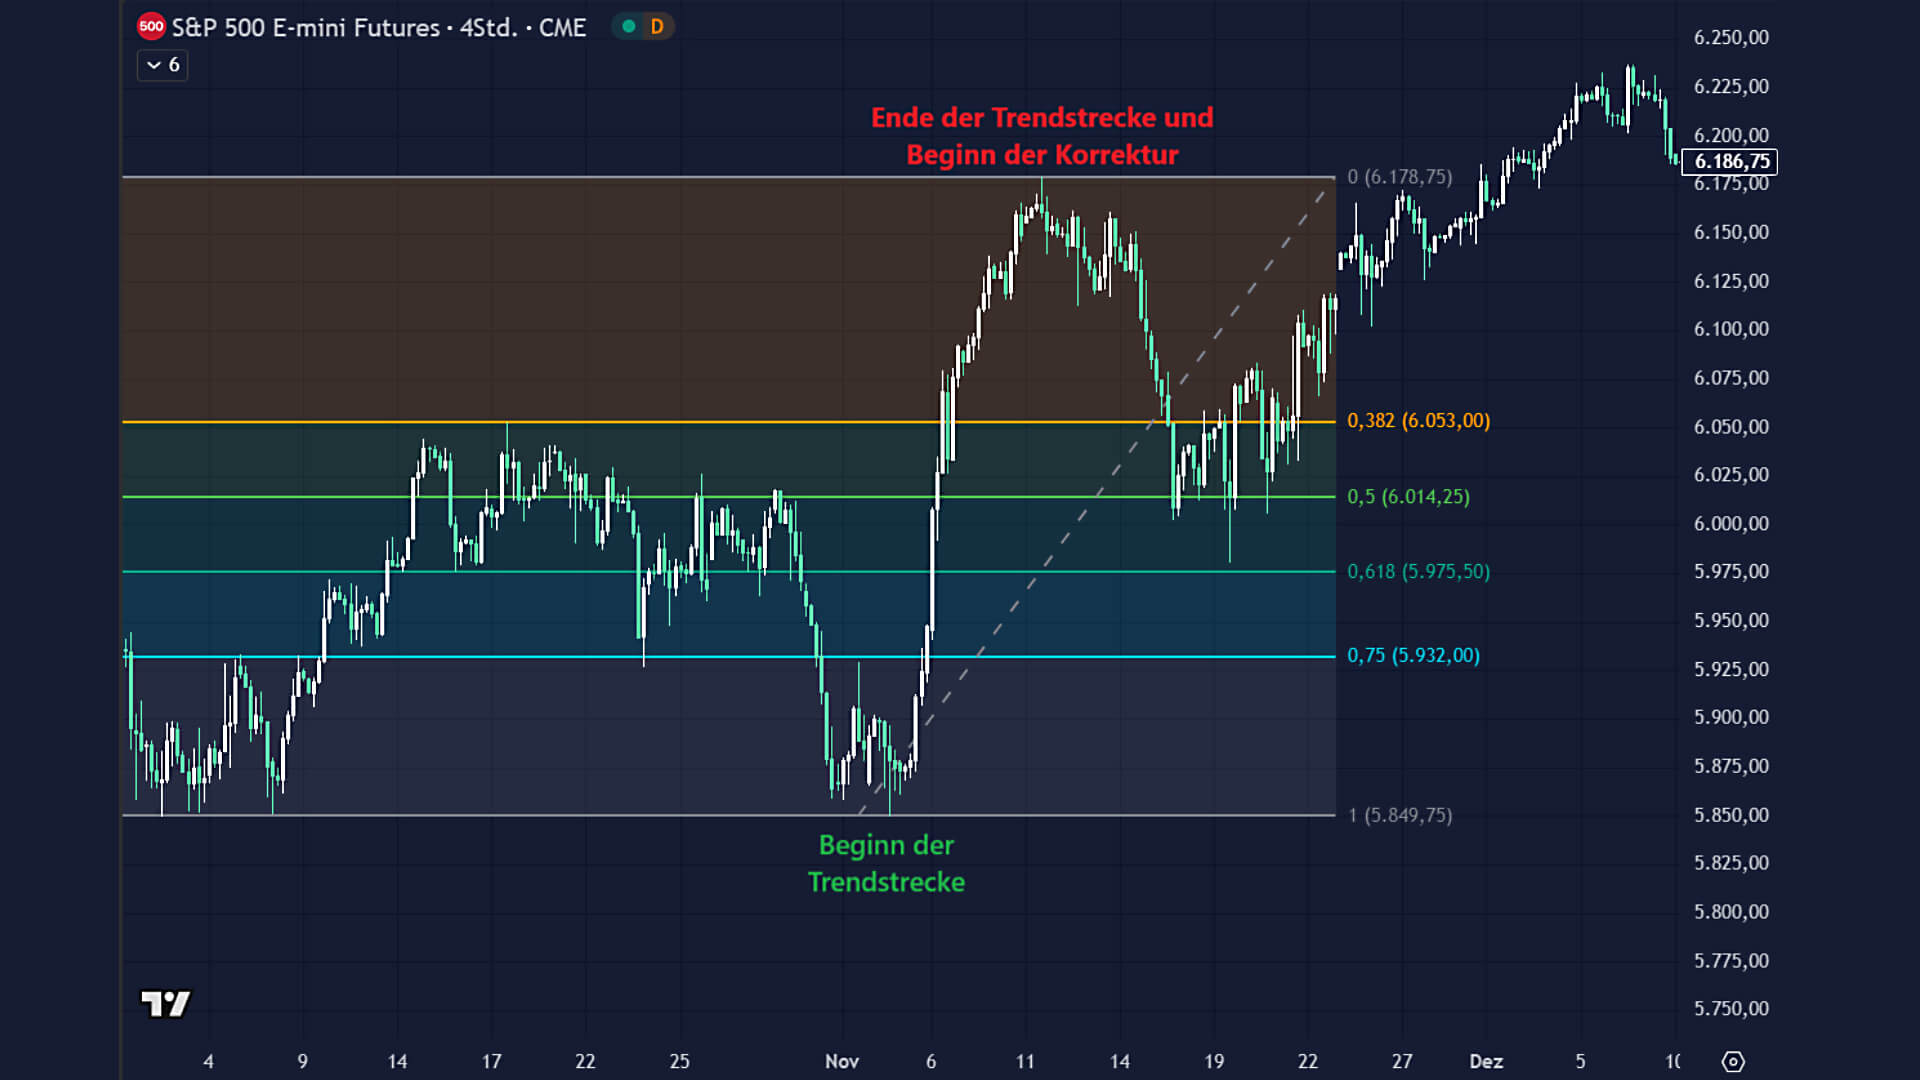
The original example shows the S&P 500 E-mini future (ES) in 2024. After a rise, a low at 5,849.75 and a high at 6,178.75 were connected. The earlier body text said 6,178.85, while the chart itself labels 6,178.75. The correction first touched areas around 38.2% and 50%, then price rose again. That is the sequence in this historical snapshot, not proof that these levels work in general.
Original example: ES, 2024. The German labels identify the start and end of the trend move. The later price path helps explain the anchor choice. Open the image for full size.
Why choose that low? It formed after a decline and a short sideways phase. Price then broke upwards quickly; the area had also been visible several times in October. Those are intelligible reasons for the anchor. The image cannot tell us whether everyone would have chosen the same low beforehand. Selecting the range only after seeing the subsequent reaction turns a fit in hindsight into a false forecast.
The high was a prominent extreme in the period shown. The low, by contrast, was an interim low within the larger uptrend. That is why the reasoning behind both anchors matters more than how neatly the lines appear on the chart. Another defensible start to the move would have produced different retracement prices. The image shows how to discuss a choice; it cannot settle it once and for all.
05
Three common mistakes
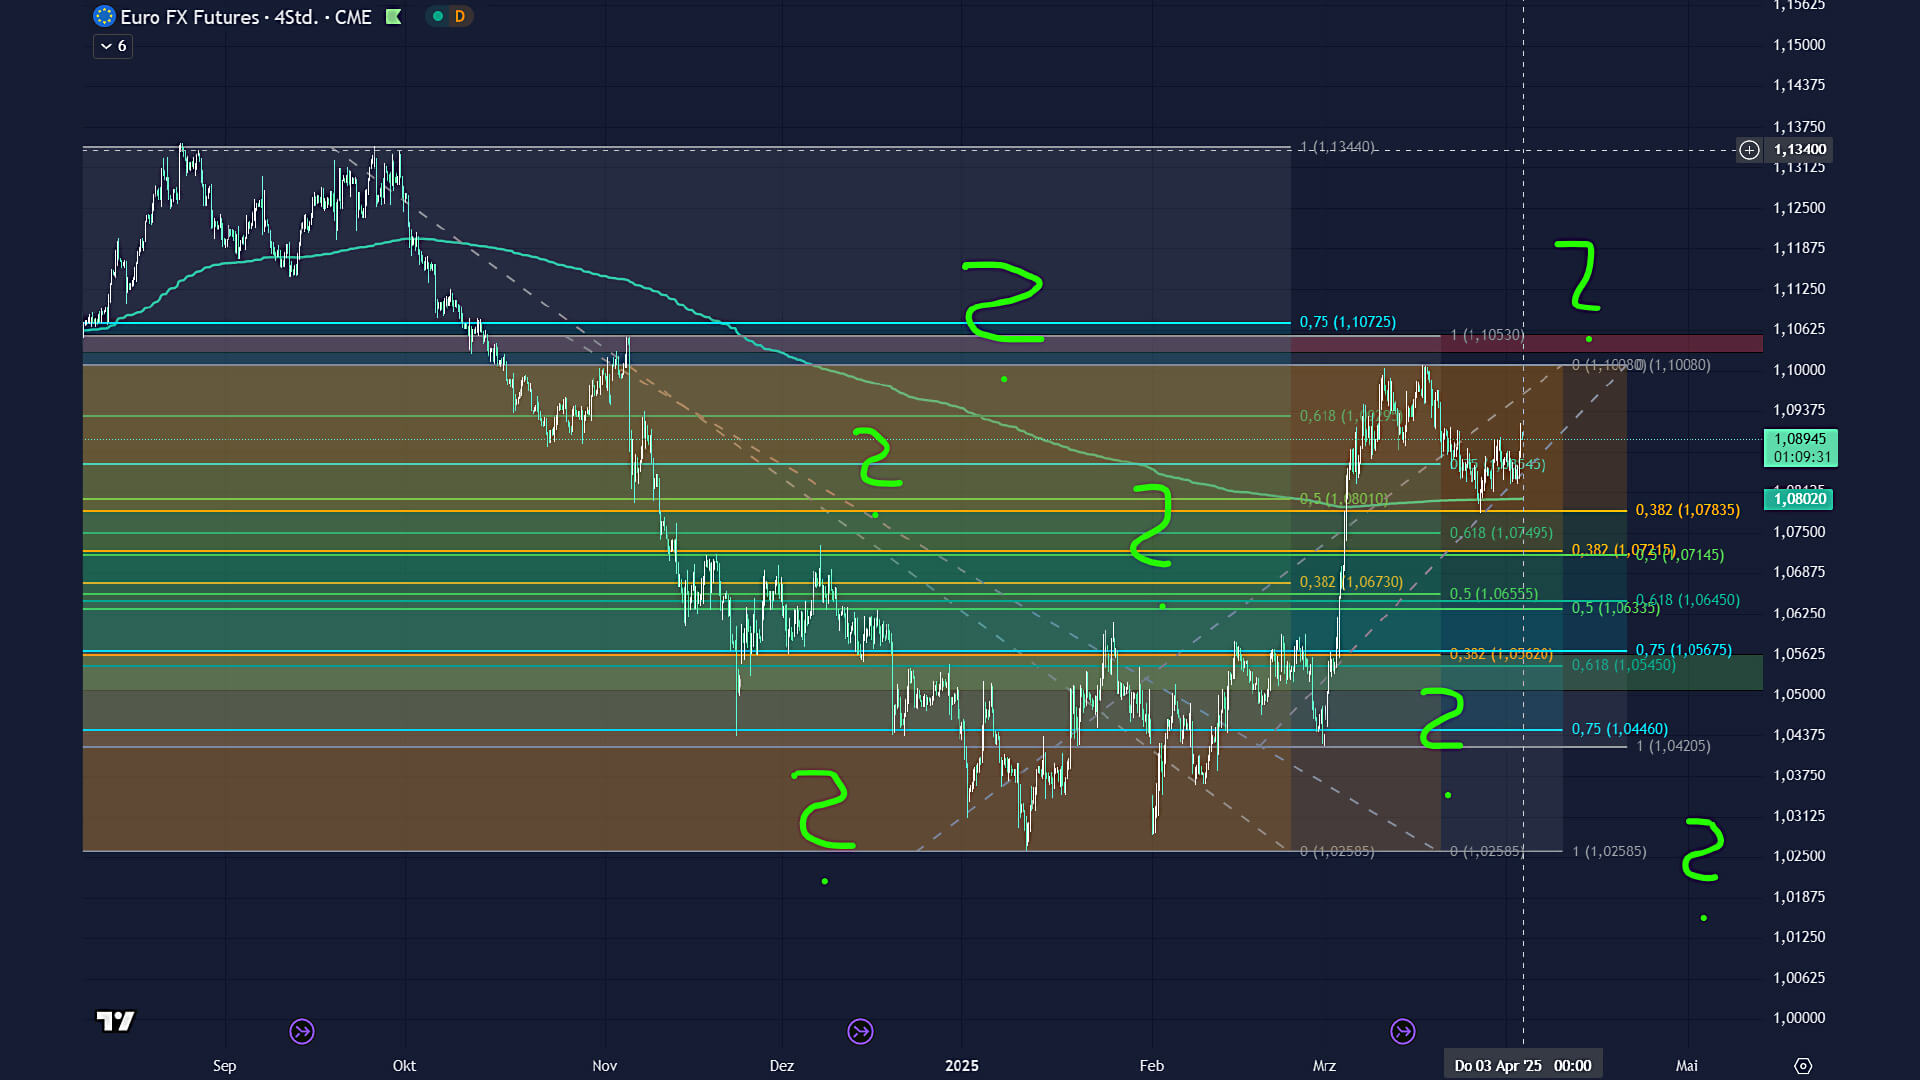
Mistake 1: Too many retracements. Measuring different moves and timeframes at once creates a tangle of lines. Some level will almost always be near the current price. The original Euro FX futures image shows just that overlap: several coloured grids and numerous possible “hits”. For an analysis you can assess, focus on one or two justified moves.
Original example: too many grids. Overlap makes a hindsight match easy; it does not provide a forecast. Open the image for full size.
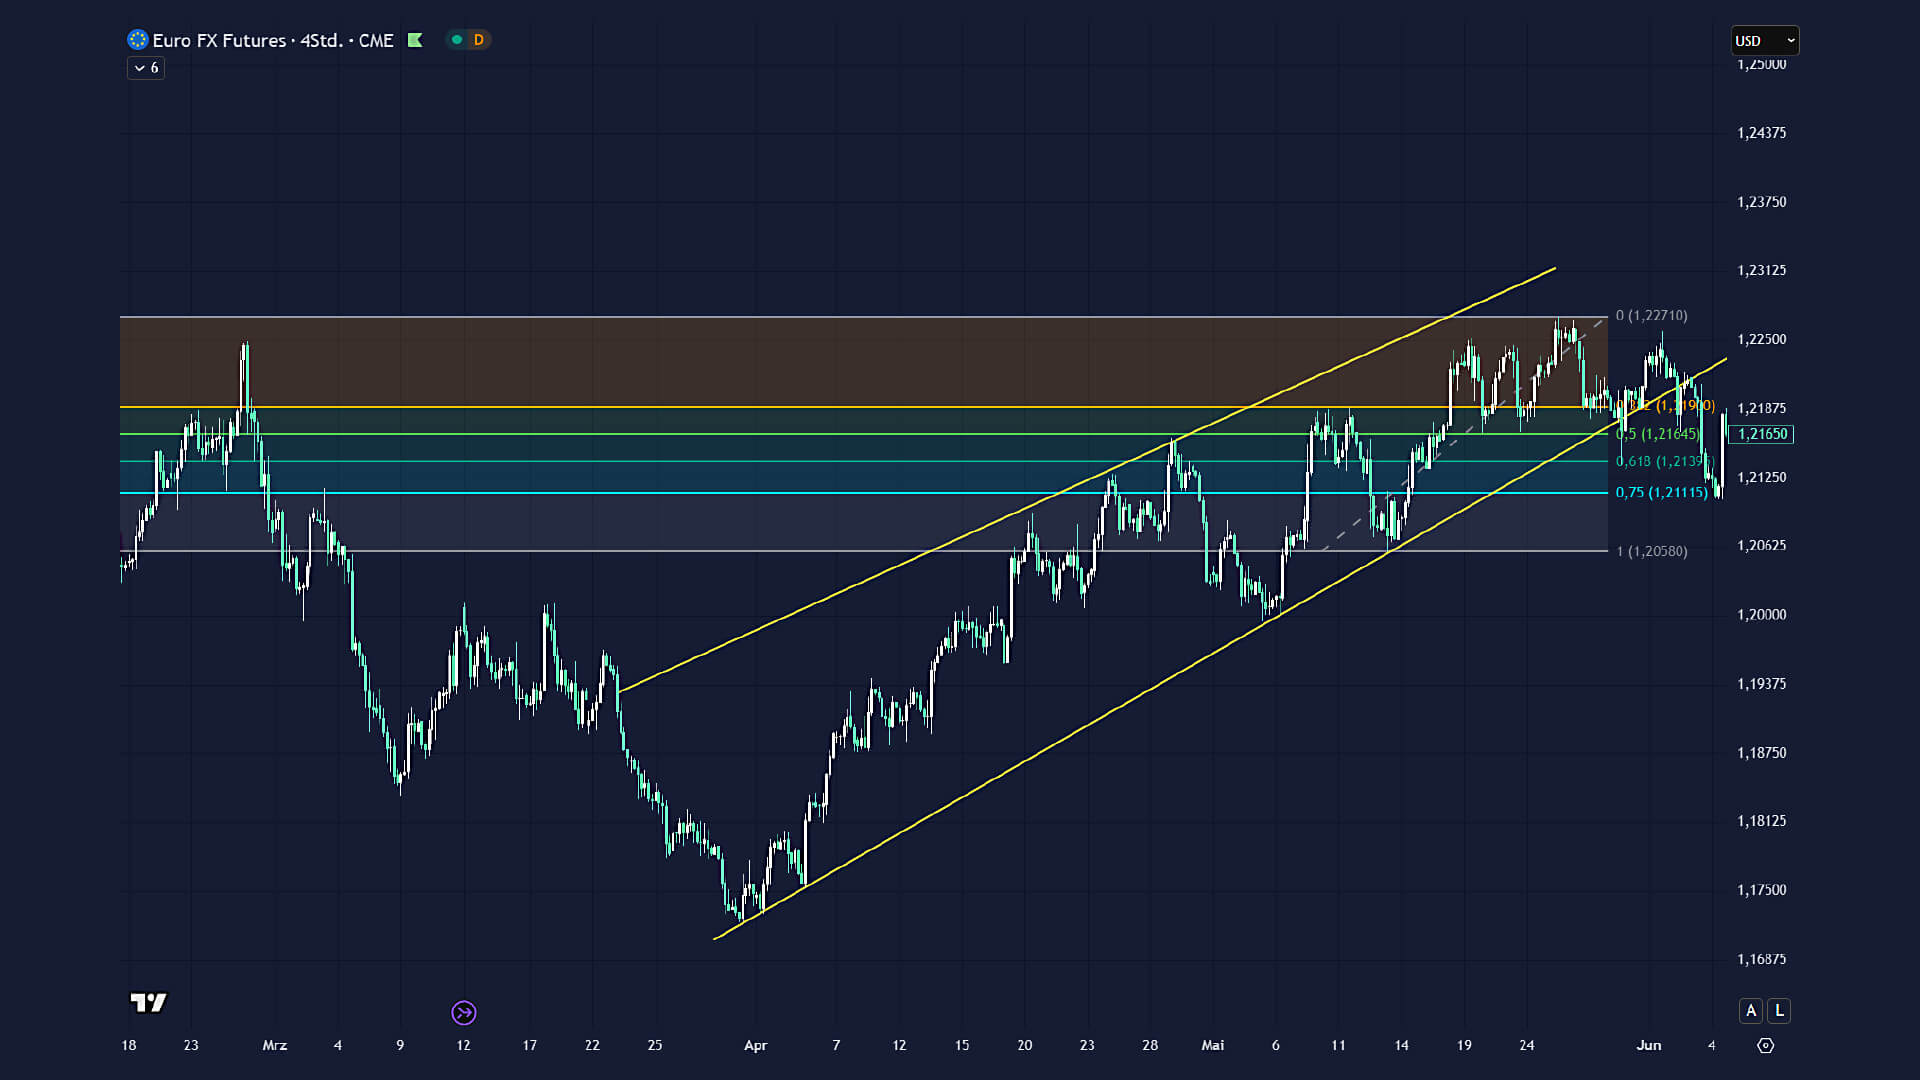
Mistake 2: Unclear highs and lows. A retracement always measures only the range you select. Small interim moves produce different lines from a prominent swing. The second Euro FX futures image shows a single grid within a longer price history. It invites the question of whether the chosen points fit the move under study. Clear selection rules recorded beforehand matter more than an apparently perfect match in hindsight.
That does not mean there can be only one permissible high and low on an entire chart. Different timeframes may justify different trend legs. Keep them distinct, though: Which question does the daily chart answer, and which the four-hour chart? Changing the timeframe after a losing trade can let a fresh grid hide the mistake rather than explain it.
Original example: anchor choice. Check which move the grid actually measures. Open the image for full size.
Mistake 3: Relying on Fibonacci alone. A touch of 61.8% is not a complete trading decision. Check whether market structure and other observations fit the idea, and define entry, invalidation, exit and risk. Even a confluence of indicators is not yet a demonstrated edge. Only an evaluation of many cases traded under the same rules can show whether a method holds up.
06
Where Fibonacci fits in a trading method
Fibonacci is no miracle cure and no system that does the work for you. It can help you describe a price move deliberately: Where did it start, where did it end, and how deep was the correction? Above all, the method makes you state your chosen anchors and areas of interest openly.
That makes it useful as part of an analysis. It does not turn possible reversal areas into predictable turning points. A pullback may touch a line, move through it or turn before reaching it. You see the market's response only as it develops. Swing tradingAn approach in which positions are commonly held for several days to weeks to participate in medium-term price moves. offers a longer timeframe for this observation, but no automatic advantage from Fibonacci.
If you want to develop your own approach, define in advance which market phase, trend leg and confirmation you seek. Record when the idea would be invalidated, too. Then review losing trades, costs and different market phases. That lets you examine whether a rule is repeatable instead of collecting only charts that worked out.
In its swing-trading programme, TradeNeon places retracements in a specific Fibonacci system for futures and a wider process of market analysis, system rules and risk management. Other trading approaches exist as well; there is no universal single system. The complete process matters more than one percentage line. The programme is currently offered in German.
Swing trading programme
From chart to trading routine
Explore how TradeNeon brings analysis, rules and risk management together. The programme is currently available in German.
It is approximately the reciprocal of the golden ratio. In a retracement, it marks 61.8% of the chosen earlier price move. It is neither a reliable turning point nor an entry signal.
Is 50% part of the Fibonacci sequence?
No. Half the move is a commonly added chart level, but not a ratio derived from the sequence.
Are 75% and 78.6% the same?
No. The latter comes from the square root of 0.618; 75% is a separately added level. Any level used should belong to a method defined beforehand.
Can I trade from Fibonacci lines alone?
A line only locates a point within a past price move. You still need rules for context, entry, invalidation, exit and risk.
FibonacciRetracementSwing tradingChart analysis
Simon Reichert
Swing trading coach · TradeNeon
Simon Reichert is a swing trading coach at TradeNeon. He studied International Business Management, worked in finance and auditing, and has traded actively since 2022. His focus is swing trading, the broader market context and risk management.
CoT Data in Swing Trading: Putting Positioning in Context
Oliver Sparing
Founder & Head of Trading · TradeNeon
Webinar in German, August 1, 2024 · 67 min video
Every Friday, the US agency CFTC publishes the Commitments of Traders report, which shows how reportable traders are positioned in futures markets as of the Tuesday before. Which trader groups appear in it and why an extreme value alone does not justify a trade is what this article sets out. Positioning can become more meaningful in relation to total open interest and to the number of traders.
Three groups, three positions. Reported anew every week.Image: TradeNeon
Positioning first. Then the chart.
CoT data gives you a direction. You find the entry with market logic and the chart.
The Commitments of Traders report shows once a week how reportable traders are positioned in futures; what stands behind a single position, it does not show. Because of the delay of a few days, it suits swing trading best. Classic indicators such as net positioning and the COT index look at each group on its own; positioning can be more meaningful in relation to total open interest and to the number of traders, combined with a chart-based entry logic.
CoT stands for Commitments of Traders. The report of the US agency CFTC shows how traders are positioned in a futures market. When a trader exceeds the reporting threshold the CFTC sets for a market, their positions are reported to the CFTC through reporting firms such as clearing members and brokers. Most of the futures private traders work with are listed at the CME. The reference date for the reported positions is always the Tuesday; on the following Friday the CFTC publishes the report. It is publicly available on the CFTC website.
The delay of a few days is only of limited help for day trading, even though there are individual use cases. For swing trading, it barely matters, especially since the data usually changes only a little from one week to the next. That is why CoT dataThe weekly positioning data of the Commitments of Traders report of the US agency CFTC on futures markets. is mainly a tool for swing traders.
The CFTC provides the report in various formats, including comma-separated for evaluation in Excel. There are two report types: the classic legacy report and the more modern disaggregated report. Each comes as “Futures Only” and as “Futures-and-Options Combined”; private traders mostly use the futures-only version. The table shows how the trader groups differ.
Criterion
Legacy report (classic)
Disaggregated report
Reportable: commercial / hedging
Commercials
Producer/Merchant/Processor/User (one category, roughly equivalent to the commercials)
Reportable: swap business
Not shown separately, generally included in the commercials
Swap dealers
Reportable: speculation
Non-commercials
Managed money
Reportable: other
Not shown separately, mostly included in the non-commercials
Other reportables
Not reportable
Nonreportable positions: one combined residual (total open interest minus reportable positions), individual traders not shown
Nonreportable positions: one combined residual (total open interest minus reportable positions), individual traders not shown
In the legacy report, commercialsTraders who, by CFTC classification, use futures for hedging in connection with their business, such as producers and processors of a commodity. are traders who, by CFTC classification, use futures to hedge in connection with their business, such as coffee farmers as producers and processors as buyers. The non-commercialsReportable traders who are not classified as commercial, typically funds and other speculators. are reportable traders who are not classified as commercial, typically funds and other speculators who bet on the price movement. All positions below the reporting threshold end up in the nonreportable positions, which include most private traders.
The disaggregated report knows four reportable categories. The swap dealers are a special case: a swap dealer, for example, secures a wheat farmer a price off the exchange and speculates that the wheat price will rise. If the risk becomes too large for them, they hedge on the futures exchange. In the indicator view, this looks similar to the commercials, while the way of thinking is closer to that of the speculators; that is why the swap dealers are filtered out in the analysis shown in the webinar. The managed moneyAsset managers such as CTAs, CPOs and funds that trade futures for clients (CFTC definition). In the disaggregated report, comparable to the non-commercials in the legacy report. category covers asset managers and funds, in other words the large speculators. The other reportables are everyone who does not fit into any other category.
The report also shows how many traders per category hold a position (the number of traders). Meant are the reportable traders per category, often companies or funds. This figure is easily overlooked. Three figures are at the center: total open interestThe number of open futures contracts in a market. It rises when new contracts are created and falls when existing ones are closed; trading volume, by contrast, counts every transaction., the positioning of the commercials and that of the large speculators.
04
Which group matters most today
Ten years ago, when the topic came up in Germany, producers were seen as the group to watch first. The logic behind it: a coffee farmer sees the weather and the plants and is best placed to judge whether the price is fair.
Commercials use the futures markets in the classic way for hedgingProtection against price fluctuations, for example by buying or selling futures.. When the price falls, processors buy futures because the commodity is cheap. When it rises, producers sell futures because the price becomes attractive. Both thus stand against the trend movement. This role has shifted: market participants among the commercials now speculate as well, which makes their behavior less clear to private traders than it used to be.
With the non-commercials, the business model is clearer: they want to profit from price movements, backed by their own analysis departments. What stands behind a single position, however, the report does not show, because the CFTC assigns traders to a category by their predominant business. That this group judges the markets correctly most often is an assessment: “It can now be evaluated statistically that the non-commercials, the large speculators, are right most often in their assessment of the markets. Their intention is always clearly set,” says Oliver Sparing. His main focus is therefore on the non-commercials, in the disaggregated report on the managed money; with them he develops his fundamental bias.
05
Liquidity and the warning sign
The native CoT indicator in ATAS shows the net positions, using gold as the example: green for the large speculators, red for the commercials. Normally, the lines run toward each other in a funnel shape. When the price falls, the large speculators build short positions and the commercials buy.
Visible: daily chart of the gold future (GC, COMEX), below it the ATAS indicator “COT Net positions” from the legacy report: green line large speculators (non-commercials), blue line small traders, red line commercials. Green and red mostly run against each other. In Oliver's reading, speculators and hedgers thus form each other's counterparty. From minute 18:08. Image: ATAS Deutschland
The CoT report shows positioning, not directly the liquidity in the market. liquidityThe supply of prices and counterparties in the market. Where buyers and sellers each find a counterparty, the price stays more stable. can be derived from it: if speculators and hedgers each form the counterparty to the other, that keeps markets stable. A marketplace makes the idea tangible. If 50 vendors sell eggs there, the price stays stable. If only one vendor still has eggs, they can drive the price as they please. The price is determined first and foremost by supply and demand in the cash markets; the futures markets offer hedging options and can help keep prices stable.
This gives rise to a possible warning sign. Oliver Sparing puts it this way: “If both suddenly start trading in the same direction, it gets critical, whether up or down, in stock markets of course mainly down. If speculators and hedgers alike stand out through selling, the market lacks liquidity.” The time in early 2020, when Covid emerged, is worth a look. For stock indices such as the S&P 500, the informative value of CoT data is considered lower than in commodities; as a look at the health of the market, it can still be useful. In day trading and swing trading alike, liquidity stays in view.
06
Classic indicators: net positioning and the COT index
The best-known indicators are net positioningLong positions minus short positions of a trader group as an absolute value. and the COT indexAn indicator by Larry Williams that normalizes net positioning to the highest and lowest value of a period and outputs it in percent.. Net positioning subtracts the short positions from the long positions of a trader group. When the line rises, more was bought than sold in that week. It stays within the respective group and does not put it in relation to others. It shows mainly whether positioning is rising or falling. Indirectly, it can also give a hint about the liquidity of the market.
The COT index goes back to Larry Williams. It normalizes the net positioning of a group to the highest and lowest value of a period, for example 52 weeks, and states in percent where the group currently stands in between. Values near 0 or 100 are classically read as an oversold or overbought range. In the gold example, the index fell below 20 in March 2022, and the market turned. Elsewhere, it ran considerably further after an extreme value.
Visible: gold daily chart, below it the net positions, at the bottom the COT index (0 to 100) with dashed lines marking the upper and lower range. The mouse pointer marks an index value below 20, around March 9, 2022 according to Oliver. The gold price is at a high there and falls clearly afterwards. Interpretation: an extreme value can accompany a turn, but it does not trigger one. That the market can also keep running after an extreme value, Oliver shows elsewhere in the same chart. From minute 38:05. Image: ATAS Deutschland
These indicators have aged. In Oliver's observation, they no longer work as well as they did 15, 20 or 30 years ago. As basic knowledge about CoT data, the literature on it, for example by Larry Williams, is still considered worth reading.
07
Open interest and volume
Two terms are often confused: volume counts every transaction, open interest counts the open contracts. An example from the webinar: a buyer buys a futures contract from a seller. Now there is one contract, so open interest stands at 1, and one transaction, so volume also stands at 1. If the buyer sells the contract on to a new buyer, there are two transactions, and volume rises to 2. But there is still only one contract, so open interest stays at 1.
How open interest changes depends on whether the parties open or close positions. If both sides open new positions, it rises by one contract. If one side opens and the other closes, it stays the same, as in the example with the second buyer. If both close, it falls. Open interest therefore shows the trading interest in a market. That lets you assess whether a price move comes from new positions or from market participants taking profits.
08
Two weaknesses and your own evaluation
Two weaknesses stand out in the classic indicators. First, they look at one group on its own. If the net long open interest of the commercials rises, that is less meaningful when the total open interest of the market grows much faster in parallel. Seen in relation to the overall market, positioning becomes more meaningful.
Second, they refer only to open interest and not to the number of traders holding a position. An extremely high open interest that only three or four out of 200 traders hold says something different from one that almost all available traders have built.
That is why Oliver Sparing first built his own Excel spreadsheets with his own algorithms, into which he entered the positioning of the managed money and the commercials every weekend. The evaluation cost him three to five hours each weekend. Later, together with a programmer from the swing trading programme, software emerged that runs this evaluation every week: the TradeNeon software, today Futures Insights.
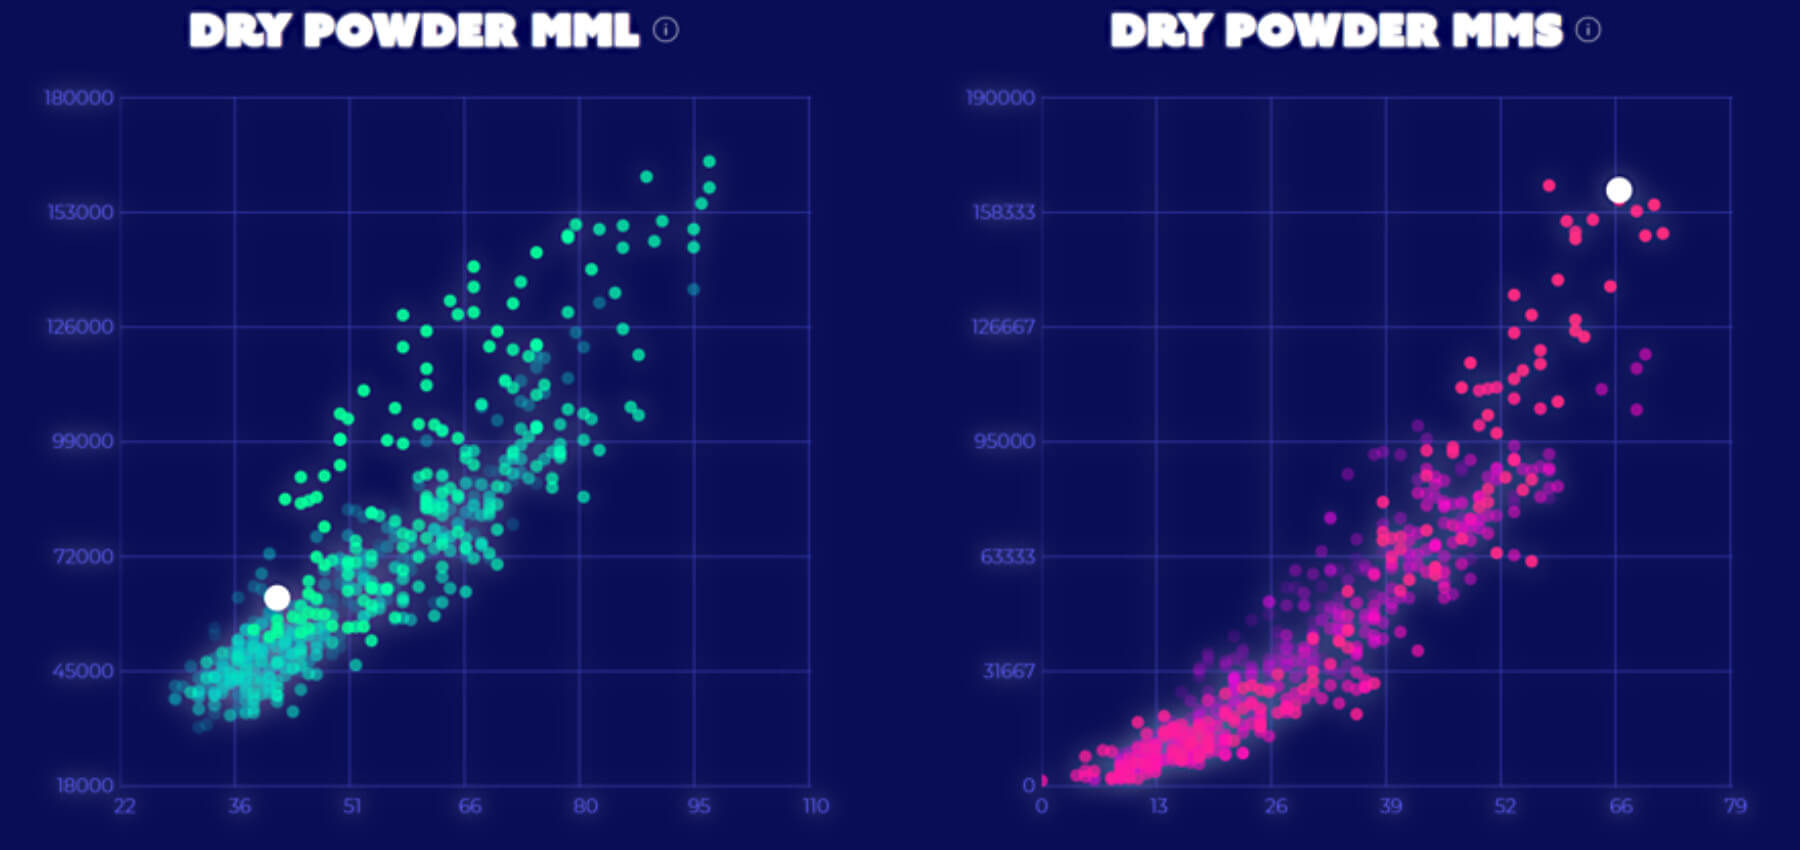
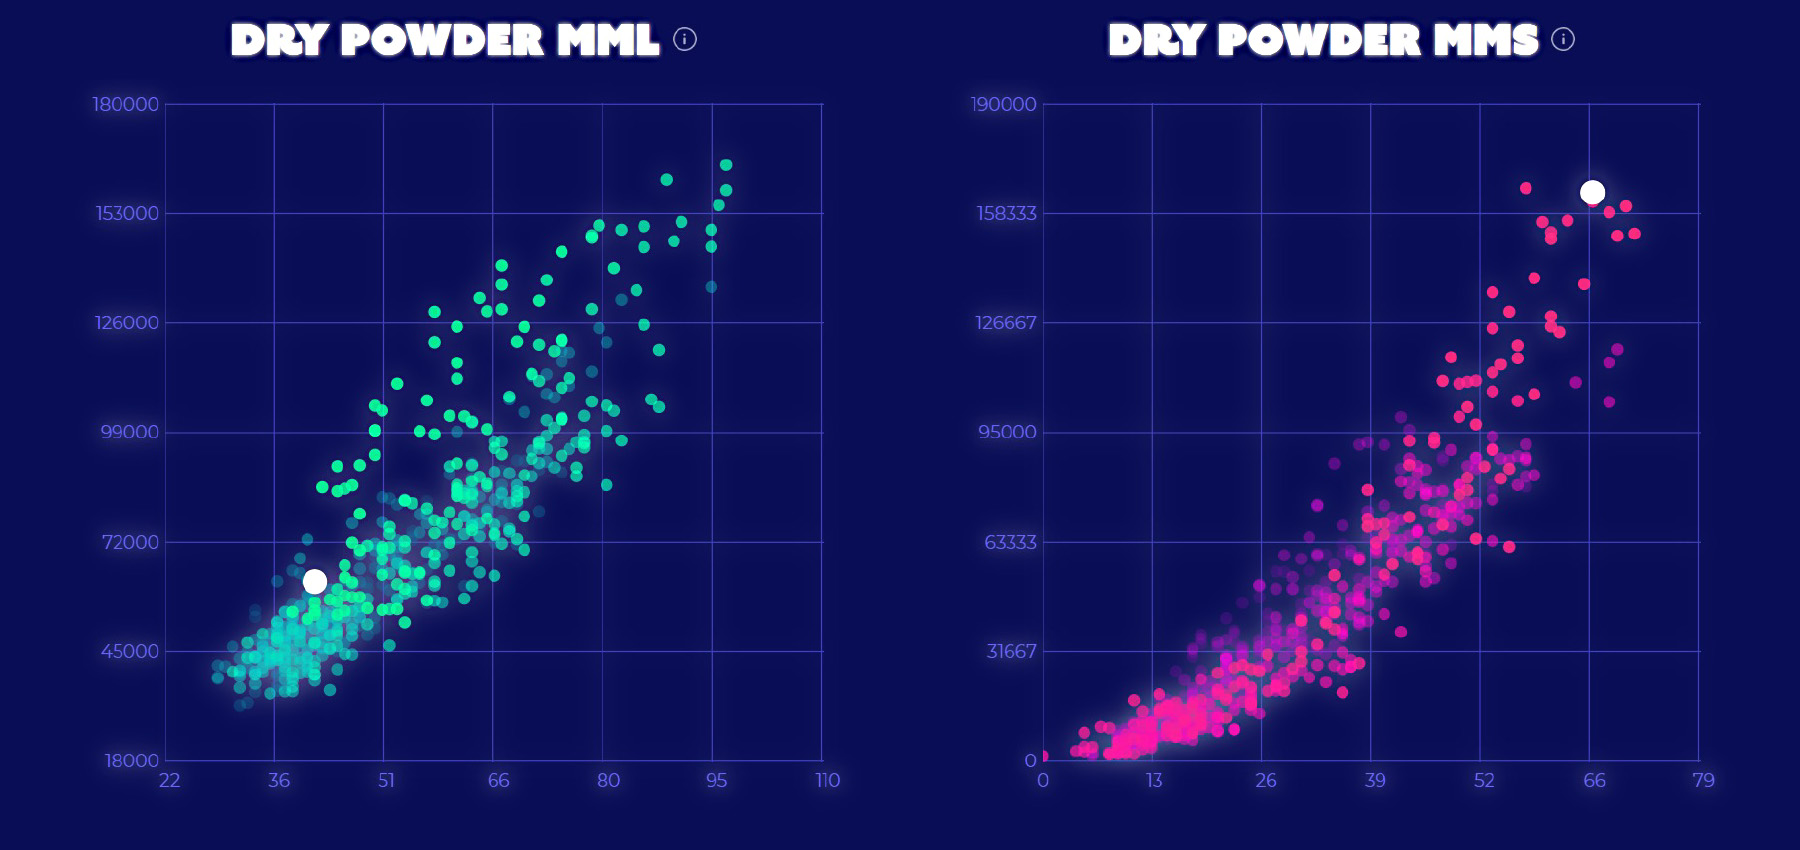
In one chart of the TradeNeon software, open interest is plotted against the number of traders. The y-axis shows open interest, the x-axis the number of traders who hold it. A historical point cloud emerges: fainter dots lie further back, and the large white dot is the current report. In the gold example shown (managed money long, as of July 23, 2024), 105 traders hold long positions with an open interest of 197,802 contracts; the dot sits in the upper middle of the cloud. As a thought experiment, the extreme case at the top right can be played through: if the price rises while the current report sits there, many traders are already historically high long, and it is hard to say who is left to buy. Oliver Sparing himself calls this back-of-the-envelope math, but has found such situations valuable in practice. Extremes can, however, build up further, so caution is needed.
Visible: TradeNeon software (then tradeneon.app), gold, two point clouds “Dry Powder MML” (managed money long, turquoise) and “Dry Powder MMS” (managed money short, pink). The y-axis shows open interest, the x-axis the number of traders; fainter dots lie further back in time, the large white dot is the current report. The tooltip on the left gives the status of July 23, 2024: 105 traders with long positions, open interest long 197,802 contracts. The white dot sits in the upper middle of the cloud, not in the extreme range at the top right; Oliver describes that extreme case as a thought experiment. From minute 55:53. Image: ATAS Deutschland
09
Why extreme values are not a trigger
What an extreme value says shows in the example of the commercials' short positions. When this value falls to a historically low level, the producers evidently no longer sell because the price is too low for them. That is useful information, and a private trader can wait for the price to turn.
This is exactly where the catch lies. When it is said that CoT data no longer works, that can also come down to how it is applied: an extreme value does not mean you buy or sell right away. In the gold example, the price keeps rising although the indicator outputs ever more extreme values.
Fundamental data such as CoT, seasonality and term structure are therefore something you combine with a chart-based logic to find entries. That takes an understanding of market logic and of auction and price formation processes. VWAP, volume profile, price action and technical analysis are options for entries. For swing trading, fundamental data such as CoT is a tool for checking the starting point before you think about buying or selling.
10
How the large speculators trade
Oliver Sparing describes the behavior of the large speculators like this: “The large speculators start extending their short positions in downward moves. The further the market falls, the more short they are. When the price turns and starts to rise, they start building their long positions, and the further the market rises, the more they buy.” Private traders often do the opposite: they see a falling market, think it can hardly go lower, buy and watch it keep falling.
He states the consequence like this: “If you want to make money in the markets, trade like the large speculators and not the other way around. You want to buy into rising prices and sell into falling ones, and you never want to be the hero who catches the absolute low of a move.” For Oliver Sparing, this is the most important message of the webinar.
11
What you can take away from the webinar
The CoT report is a swing trading tool. The data appears weekly and usually changes slowly. For short-term trading, it helps only to a limited extent.
The first look goes to the non-commercials. In the disaggregated report that is the managed money; with them, a fundamental bias can be developed. What stands behind a single position, the report does not show.
Positioning needs context. Put it in relation to total open interest and to the number of traders holding a position.
An extreme value is not yet an entry. Combine the data with a chart-based logic and an understanding of market logic.
“Just because this data has reached an extreme value does not mean we wildly click on buy or sell.”
Oliver Sparing in the ATAS webinar (translated from German)
12
About the webinar
The webinar ran on August 1, 2024 as part of the ATAS Deutschland webinar series on the YouTube channel of ATAS Deutschland. It is held in German; on YouTube, you can switch on machine-translated subtitles. ATAS is a trading platform for order flow analysis. Oliver is a regular guest there; you can find all appearances on our guest appearances page.
Note: the video is a recording from 2024. Brand and company names in the video reflect the status at that time.
Free Plan · Futures Insights
CoT data in relation to the overall market
Futures Insights calculates three fundamentals, including CoT data, and presents them in five indicators. In the Free Plan, you can view gold (GC) with all indicators.
CoT stands for Commitments of Traders. When a trader in a futures market exceeds the reporting threshold set by the CFTC, their positions are reported to the US agency CFTC through reporting firms such as clearing members and brokers. The reference date for the reported positions is always the Tuesday; on the following Friday the CFTC publishes the report. It is publicly available on the CFTC website.
Is CoT data also useful for day trading?
Only to a limited extent. The data counts mainly as a tool for swing trading, because the delay of a few days barely matters there and the values usually change only a little from week to week. The liquidity of the market stays in view anyway.
Which trader group is at the center?
Often the non-commercials, in the disaggregated report the managed money. Their business model is clearer: they want to profit from price movements. What stands behind a single position, the report does not show, because the CFTC assigns traders to a category by their predominant business. With the commercials, the picture is less sharp, because market participants speculate there too.
Why is an extreme value in the CoT report not enough for a trade?
An extreme value can build up further, and the price often keeps running anyway. The data is therefore combined with a chart-based entry logic and an understanding of market logic, instead of buying or selling right away at an extreme.
What is the difference between open interest and volume?
Volume counts every transaction, open interest counts the open contracts. If a buyer sells the contract on to a new buyer, volume rises to 2 while open interest stays at 1. If both sides open new positions, open interest rises; if both close, it falls.
CoT DataSwing TradingATAS
Oliver Sparing
Founder & Head of Trading · TradeNeon
Oliver Sparing has been actively trading the financial markets since 2011. His professional roots lie in precious metals trading in Hamburg; in 2017 he learned at a London trading floor. At TradeNeon he leads the day trading and swing trading programmes and is responsible for the trading methodology, with a focus on order flow, market structure and fundamental market data. Level of Interest, Futures Insights and Lab of Trades grew out of this work. Platforms such as ATAS, Bookmap and WH SelfInvest regularly invite him as a guest. All guest appearances
TradeNeon is a web-based fundamental analysis software. Find ideal trading opportunities to execute trades with confidence and high success rates! It has never been easier!