
COT data in trading: Reading positioning

Who holds long and short positions in the futures market? The weekly Commitments of Traders report offers a partial view. It reveals neither any individual trader's motive nor the next price move. Read in context, it can help you understand positioning and the wider market.
The figures represent trader groups; the tiles represent their reported positions.Image: TradeNeon
Understand context.
Imagine playing poker and finding out afterwards how different groups bet, without seeing any individual player's cards. CoT data offer a similarly limited view: they show past, aggregated positions of reportable trader groups. This article explains who those groups are, how to compare their positions over time, and why that comparison alone is not an entry signal.
What are CoT data?
Before going deeper, let's clarify the basics: what are CoT data, and why might you consider them in trading? The CoT reportsWeekly CFTC reports on the open positions of different trader groups as of the preceding Tuesday. were not invented by trading gurus. They are published by the Commodity Futures Trading Commission (CFTC), the US regulator for derivatives markets where, among other instruments, futuresStandardised contracts on an underlying asset with a specified size and expiry. are traded.
The aim is transparency. The CFTC's predecessor began publishing monthly CoT reports in 1962, showing how different groups of market participants were positioned in US futures markets. The first monthly report covered 13 agricultural commodities. The CFTC later continued the series; the reports have appeared weekly since 2000.
Today, the reports cover numerous markets, from gold and crude oil to financial futures. The CFTC normally publishes them on Fridays at 3:30 p.m. US Eastern Time, using positions from the preceding Tuesday; holidays can shift the release. This is not a live data stream, but it consists of reported figures rather than estimates. You see more than the fact that gold's price rose: you see how reported trader groups were positioned. Individual traders and their intentions are not disclosed.
Who appears in the CoT report, and what can their positions tell us?
To understand CoT data, distinguish between trader groups. A commodity producer may hedge price risk; a fund may follow another strategy. There are also several CoT report formats.
The groups in the Legacy CoT report
Originally, the report now called the Legacy format was the only CoT report. It broadly divides participants into three groups:
Commercials
Large participants with a hedging interest, such as producers, merchants and processors.
Non-Commercials
Large investors with speculative trading intentions, such as hedge funds.
Non-Reportables
The remaining participants whose positions are part of the market but fall below the reporting threshold.
Why the Disaggregated Report exists
In the Legacy report, physical merchants and financial institutions can appear together as Commercials. For example, a bank hedging an index fund's oil exposure through futures may appear alongside oil companies. In 2009, the CFTC introduced the Disaggregated Report, which separates reportable traders more finely by their predominant business activity. The Legacy report remains available.
The groups in the Disaggregated CoT report
The main groups in the Disaggregated report are:
Producer / Merchant / Processor / User (PMPU)
This group mainly comprises companies whose primary business is connected to the physical commodity market, such as mining companies, agricultural producers and food businesses. They mainly use futures to hedgeTo limit a price risk with an offsetting position; a hedge does not eliminate every risk. business risks. A wheat producer, for example, may sell futures to protect against a fall in crop prices. A large bakery may buy futures to limit its purchase price risk.
PMPU traders can therefore be identified more clearly as a group with a physical business connection. Unlike in the Legacy report, Swap Dealers are not included in this category. That makes the group easier for traders to interpret.
These participants know their industries well. An unusual position can therefore be a clue to their risks and market environment. It does not show whether every position is a hedge, whether PMPU traders think the price is cheap, or whether prices will rise over the medium to long term.
Even within this group, however, the boundaries can blur. Some PMPU traders may use their market knowledge speculatively as well. That does not erase the value of the category, but it does qualify what we can infer from it.
Managed Money
Managed Money includes investment funds, hedge funds and asset managers, for example. The CFTC classifies traders by their predominant business activity. The category alone reveals neither the motive for every position nor a reliable forecast. Changes in this group's positions can still be useful to examine. Their holdings may follow a trend. Common, but by no means inevitable, patterns include:
- Long positions may increase in rising markets
- Short positions may increase in falling markets
That can make their movements easier to follow. Depending on the market, changes in their positions may reinforce a trend or provide a warning sign.
Swap Dealers
Swap Dealers trade swaps and other derivatives, including for clients. Their hedges may appear as futures positions in the report. The Disaggregated Report separates them from producers, merchants and processors. Their reported futures position reveals neither the risk of their full book nor their clients' motives.
Other Reportables
This is a mixed group of larger reportable participants who do not fall under Managed Money—for example, family offices or very well funded private investors. Their strategies differ, making them harder to interpret. At times they may act like speculators, at other times like hedgers.
Non-Reportables
This is the calculated residual for positions held by traders below the reporting threshold. The report does not tell us how many are private traders. Their share of open interestThe number of futures or options contracts still open; it is not daily trading volume. varies by market and reporting date.
How should you analyse CoT data?
A net position says little on its own. A comparison with earlier reports shows whether a group was unusually positioned. Two hundred thousand net short contracts may be ordinary in one market and remarkable in another. You need a historical series to judge the difference.
Analysing CoT data manually or with software
If you enjoy working with tables and do not mind updating data regularly, you can go straight to the source. The CFTC offers a free CoT data environment. You can filter reports by market and period and export data; HTML reports and historical files are also available.
The catch is that the reports are extensive. If we open the Disaggregated Futures Only report for the Agriculture sector as an HTML page, we get a view like this:
WHEAT-SRW - CHICAGO BOARD OF TRADE                                                                                                               Code-001602
Disaggregated Commitments of Traders - Futures Only, May 20, 2025
-------------------------------------------------------------------------------------------------------------------------------------------------------------
     :          :                                              Reportable Positions                                                      :   Nonreportable
     :          :  Producer/Merchant/ :                                :                                :                                :     Positions
     :   Open   :   Processor/User    :          Swap Dealers          :         Managed Money          :       Other Reportables        :
     : Interest :   Long   :  Short   :   Long   :  Short   :Spreading :   Long   :  Short   :Spreading :   Long   :  Short   :Spreading :   Long  :  Short
-------------------------------------------------------------------------------------------------------------------------------------------------------------
     :          :(CONTRACTS OF 5,000 BUSHELS)                                                                                            :
     :          :    Positions                                                                                                           :
All  :   478,028:    90,281     55,748     70,078      5,531     20,498     93,184    193,725    111,715     34,517     33,602     22,615:   35,140    34,594
Old  :   470,119:    88,187     53,760     69,739      5,792     20,017     91,913    194,524    109,879     36,381     33,179     19,513:   34,490    33,455
Other:     7,909:     2,094      1,988        816        216          4      3,107      1,037          0        184      2,471      1,054:      650     1,139
     :          :                                                                                                                        :
     :          :    Changes in Commitments from:       May 13, 2025                                                                     :
     :    -3,459:    -5,953      6,044     -1,238        161      1,837      5,063    -14,937      6,035     -3,368     -1,842     -1,664:   -4,171       907
     :          :                                                                                                                        :
     :          :    Percent of Open Interest Represented by Each Category of Trader                                                     :
All  :     100.0:      18.9       11.7       14.7        1.2        4.3       19.5       40.5       23.4        7.2        7.0        4.7:      7.4       7.2
Old  :     100.0:      18.8       11.4       14.8        1.2        4.3       19.6       41.4       23.4        7.7        7.1        4.2:      7.3       7.1
Other:     100.0:      26.5       25.1       10.3        2.7        0.1       39.3       13.1        0.0        2.3       31.2       13.3:      8.2      14.4
     :          :                                                                                                                        :
     :          :    Number of Traders in Each Category                                                                                  :
All  :       370:        84         67         23          7         14         51         80         69         55         43         40:
Old  :       370:        84         66         23          7         14         51         80         67         56         41         40:
Other:        71:        14         25          5          .          .          8          7          0          .         11          9:
     :-------------------------------------------------------------------------------------------------------------------------------------------------------
     :             Percent of Open Interest Held by the Indicated Number of the Largest Traders
     :                          By Gross Position                       By Net Position
     :               4 or Less Traders     8 or Less Traders     4 or Less Traders     8 or Less Traders
     :                 Long:     Short       Long      Short:      Long      Short       Long      Short
     :----------------------------------------------------------------------------------------------------
All  :                 12.3       16.5       21.1       27.4        8.9       11.6       15.0       19.9
Old  :                 12.5       16.8       21.4       27.8        9.0       11.7       15.2       20.2
Other:                 52.5       43.8       68.9       64.0       51.2       43.3       63.2       59.3
Wheat, 20 May 2025. This historical report keeps the dense original layout; scroll sideways on narrow screens. Original CFTC report
This historical report shows why working with raw data takes time: you must select the relevant trader groups and figures and compare them regularly. You can import CFTC files into a spreadsheet yourself or use software. Neither replaces your interpretation of the data.
Open CFTC reports, select relevant figures and keep your own overview up to date.
View CoT data alongside other market data in a tool and compare historical positions.
Analysing CoT data: a 2025 example
The Academy example from June 2025 examines soybean meal (ZM). The following historical chart shows the long and short positions of Managed Money. It does not describe current market conditions.
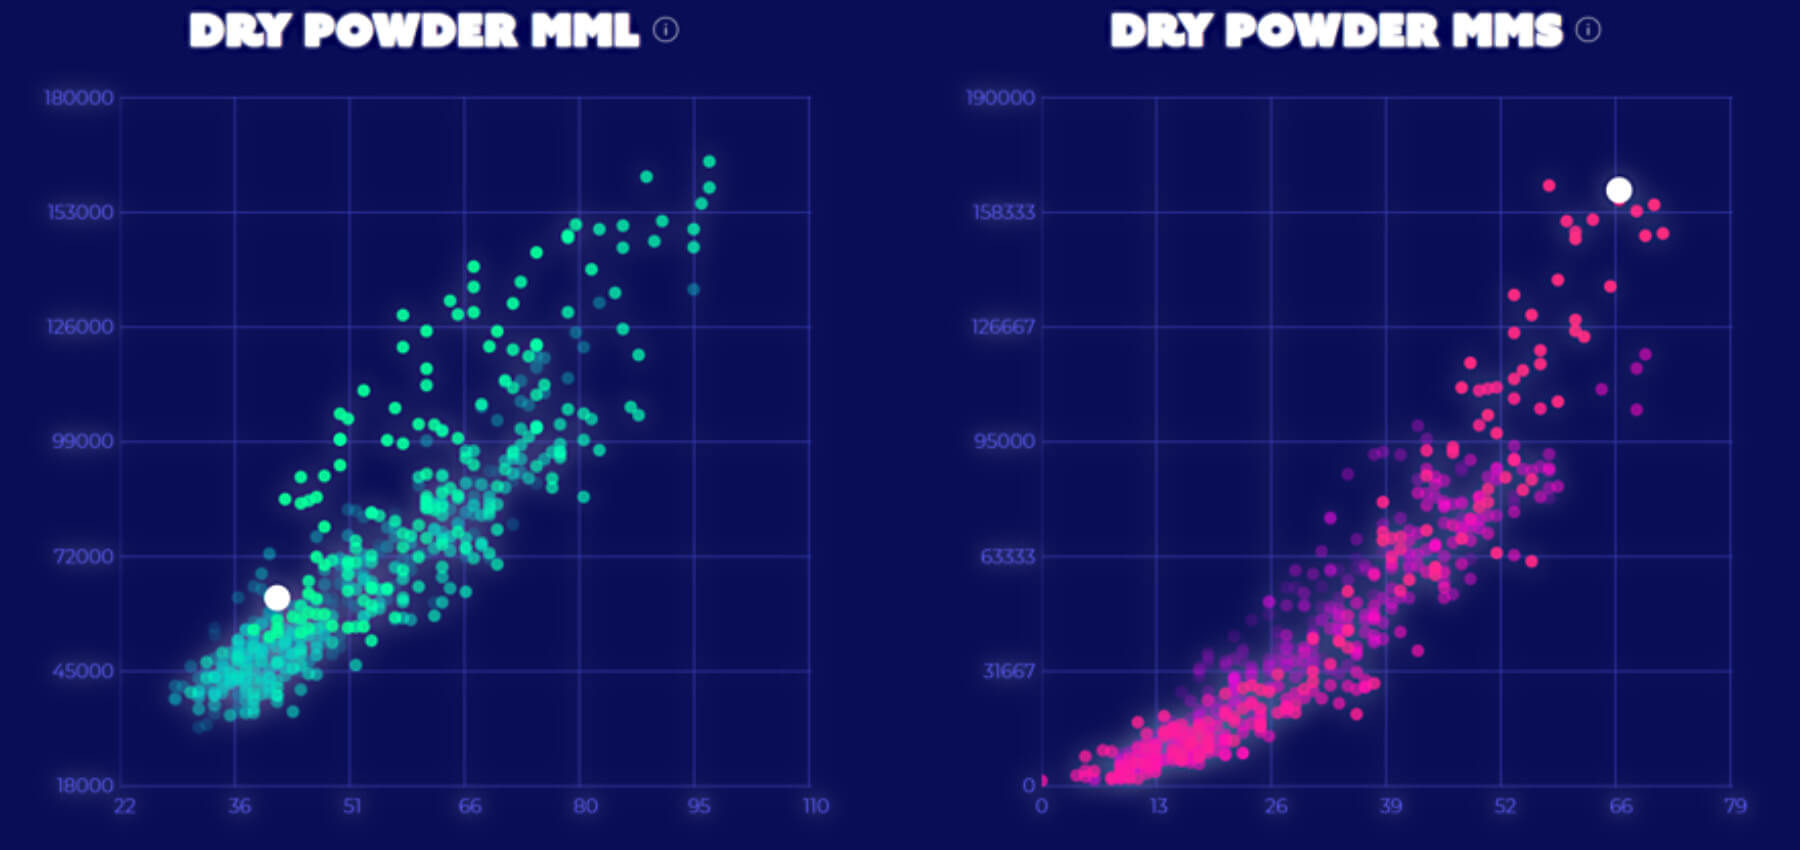
White dots mark the positions at that time; coloured dots show earlier values. In the historical comparison, the long position was unremarkable. The short side was unusually crowded. That judgement depends on past values, rather than the absolute number of contracts alone.
Looking at Managed Money's short position at that point, one thing stands out: the group was heavily short. Its short holdings grew during the downtrend shown in the historical example. The CoT report alone cannot tell us whether, or to what extent, that group moved the price.
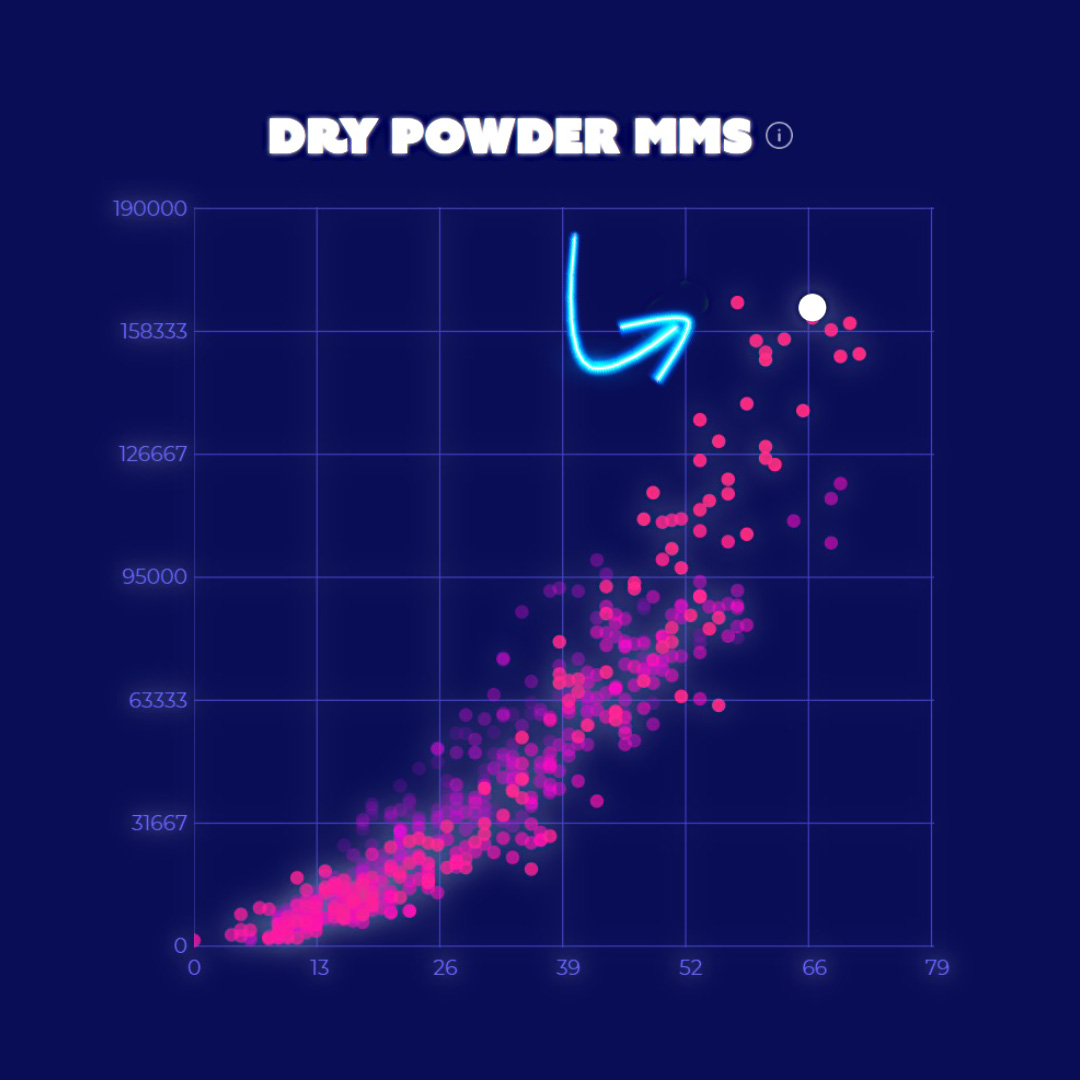
In the historical Dry Powder MMS (Managed Money Short) image, only one short position in the ten-year period up to June 2025 contained even more short contracts.
The short extreme at the time provided useful market context. It placed no limit on new short positions and did not predict a reversal. CoT data provide clues, not certainty.
How should you use CoT extremes?
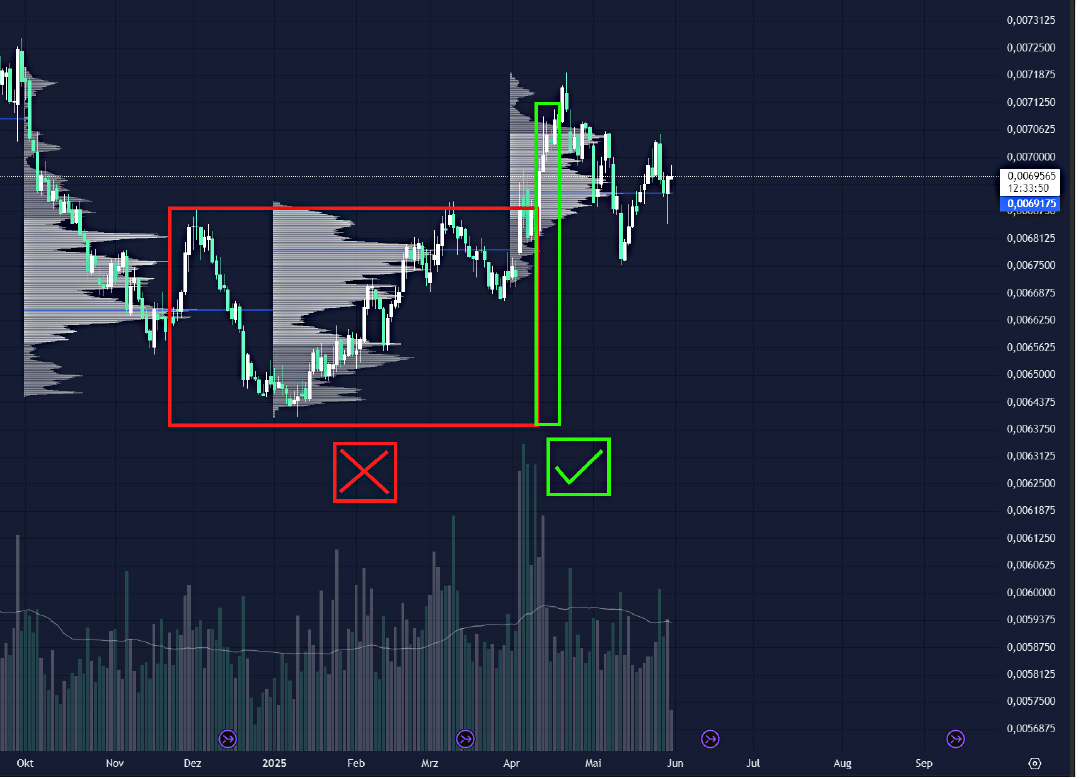
An extreme position is no reason to enter a trade immediately. Positions can become more extreme while a trend continues. Assess the longer-term market context and wait for your own chart setup before entering.
So what should you do? Once you think a long position makes sense from a fundamental perspective, the next step is chart analysis. Only when the market also offers a suitable price area and a clean setup can a CoT idea become a trade. CoT data help with the “what”; the chart helps with the “when.”
CoT data in fundamental context
A Managed Money position alone does not describe the entire fundamental picture. Compare it with physical traders' positions, seasonal patterns, the futures curve and other market measures. Several clues can support an idea; they cannot prove the future price direction.
1. PMPU positioning
It is particularly interesting when producers, processors and other PMPU traders also reach a historical extreme. If both groups are unusually positioned, examine the market context more closely; a good trade does not automatically follow.
2. Other important fundamental influences
- Seasonality: are there typical market moves at certain times of year?
- The structure of the futures curveA comparison of prices for futures contracts with different expiry dates.: is there contango or backwardation, and what might that say about supply and demand?
3. Broader context
CoT positions can become more useful when you compare them with other variables:
- Current price: is the market historically expensive or cheap?
- Number of active participants: are there unusually many or few?
- Total open interest: how many contracts are open overall?
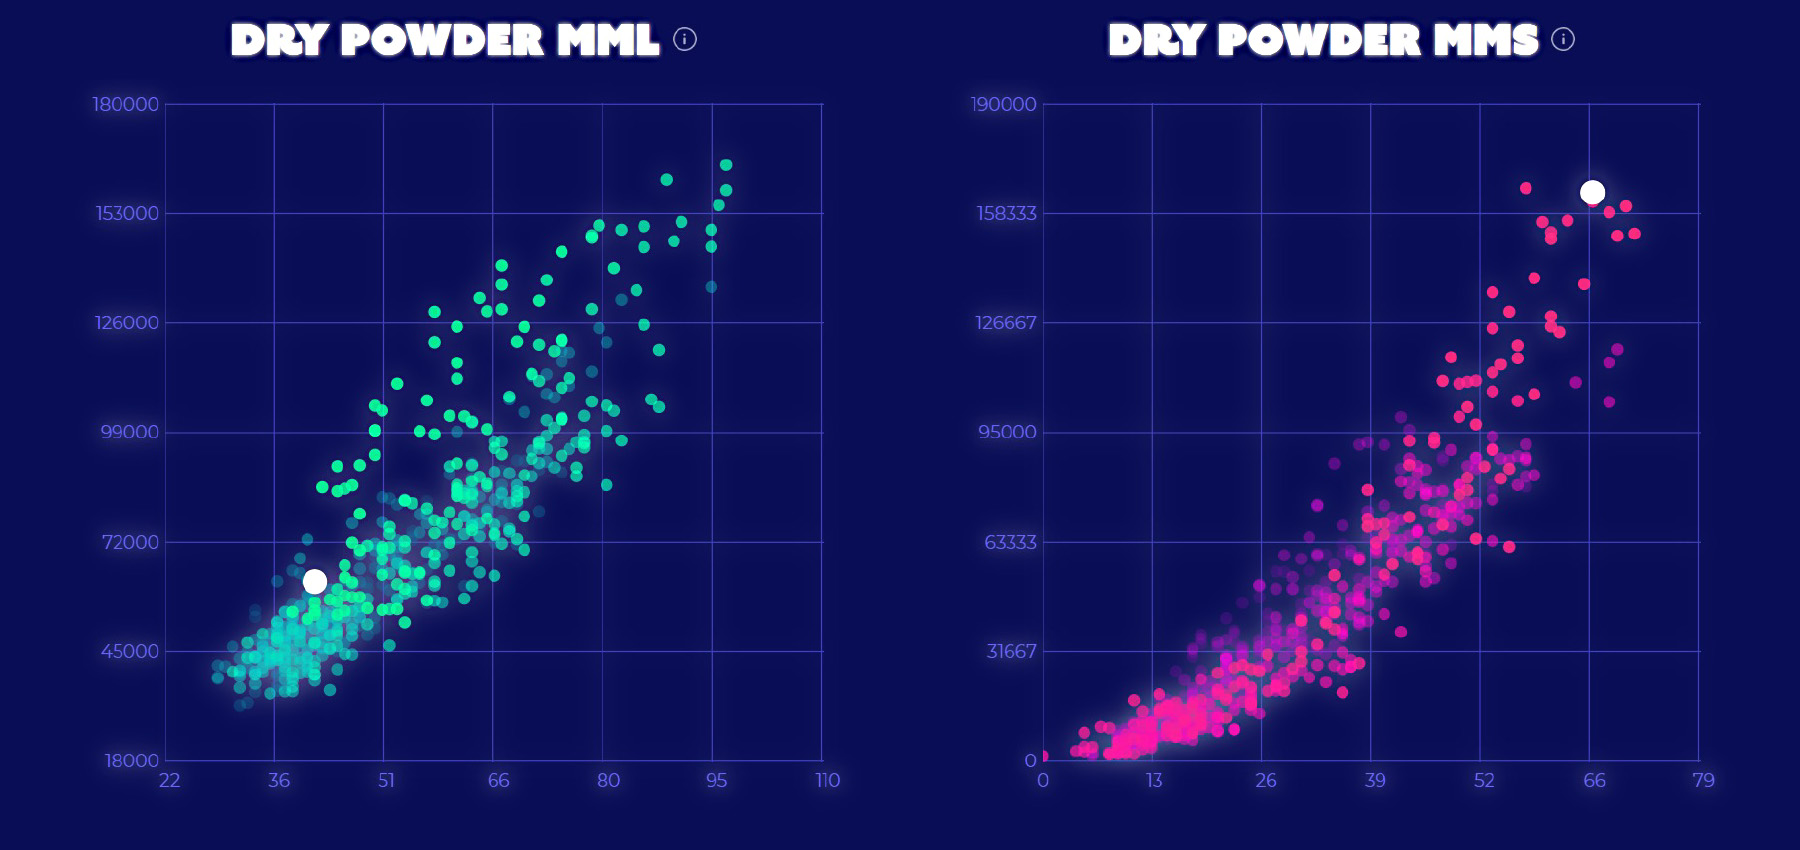
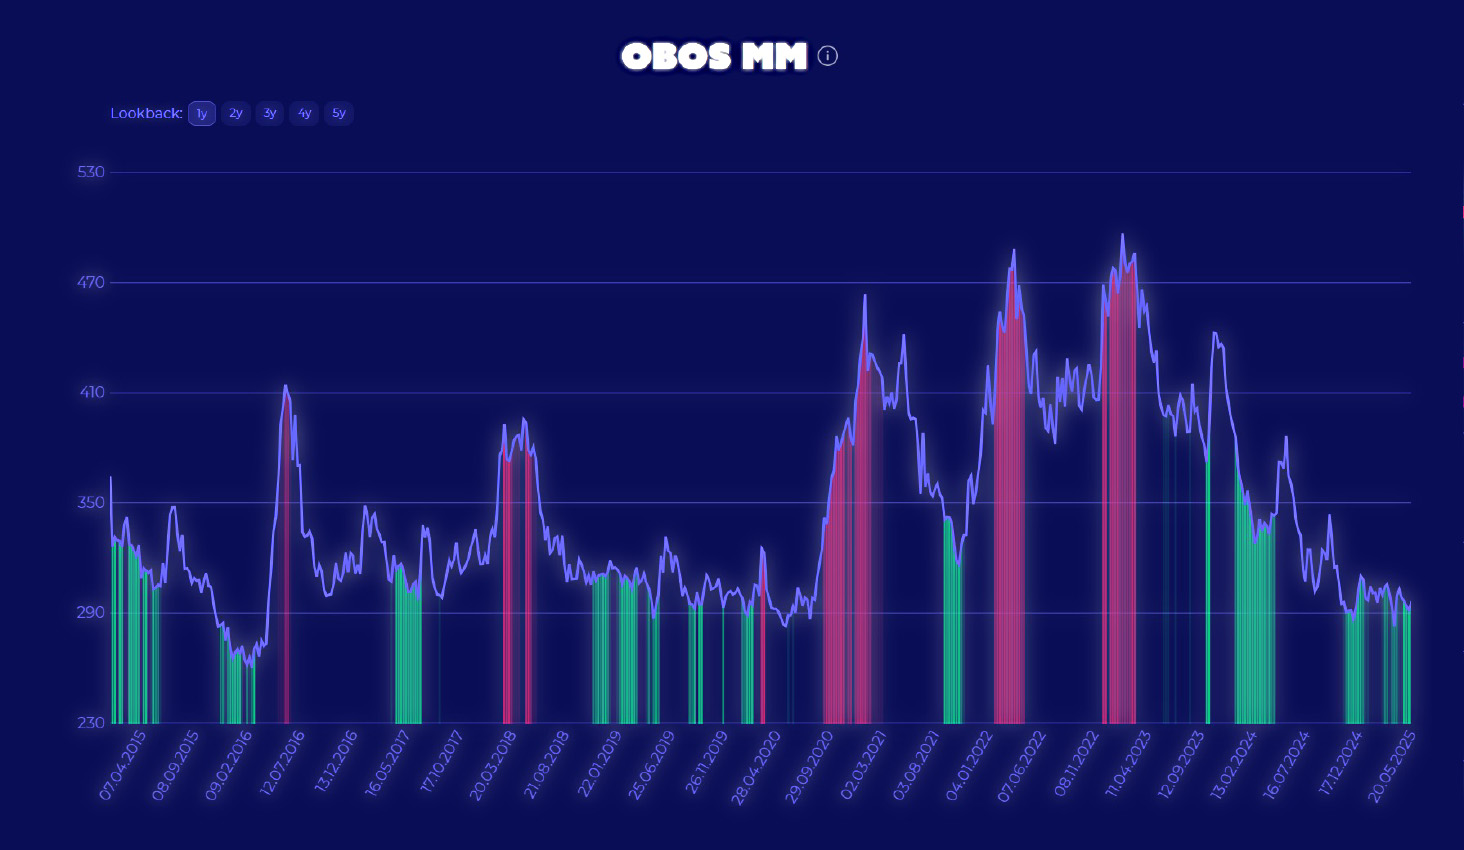
How extreme a Managed Money position appears also depends on total open interest. Compare its size with earlier positions and the market phase. The next historical image offers another view of the 2025 example; the subsequent OBOS indicator adds context.
Which markets are particularly suited to CoT analysis?
Not every market is equally suited to CoT analysis. Reportable physical participants, sufficient open interest and a meaningful historical comparison matter. The following criteria help you choose.
What makes a market suitable for CoT analysis?
Look for markets in which:
Commercial interest and physical participants
There is a clear commercial interest in hedging, and commercial participants are active in the physical commodity market.
High open interest
A substantial number of contracts remain open. Open interest helps put positions into perspective; a high value does not automatically make a price forecast more reliable.
Seasonal patterns and cycles
Historical cycles and seasonal patterns are present. Markets with a seasonal character often show recognisable positioning patterns, which can make CoT data more informative.
Markets of interest to CoT traders
Given those criteria, the following four groups of futures markets are worth examining:
Energy and metals8 markets
These commodities are tied to the physical economy. Examples include:
| Market | Exchange code |
|---|---|
| Gold | GC |
| Silver | SI |
| Platinum | PL |
| Copper | HG |
| Crude oil | CL |
| Natural gas | NG |
| Heating oil | HO |
| Gasoline (RBOB) | RB |
These markets have strong links to physical demand, sizeable commercial participants and active Managed Money positions.
Agricultural markets9 markets
Grains and soft commodities often show seasonal patterns. Examples include:
| Market | Exchange code |
|---|---|
| Corn | ZC |
| Wheat | ZW |
| Soybeans | ZS |
| Soybean meal | ZM |
| Soybean oil | ZL |
| Cocoa | CC (ICE) |
| Cotton | CT (ICE) |
| Coffee | KC (ICE) |
| Sugar | SB (ICE) |
You may see distinct seasonal phases and positions taken by Commercials against the prevailing price trend, such as buying around harvest lows.
Livestock markets2 markets
| Market | Exchange code |
|---|---|
| Live cattle | LE |
| Lean hogs | HE |
These markets are strongly shaped by biological production cycles. Commercial participants such as feedlots and meat processors often hedge price fluctuations, which can also produce noticeable positions depending on the market and period.
Currency markets6 markets
| Market | Exchange code |
|---|---|
| Australian dollar | 6A |
| British pound | 6B |
| Canadian dollar | 6C |
| Euro | 6E |
| Japanese yen | 6J |
| Swiss franc | 6S |
CoT data can also be informative here, particularly about the speculative positions of large funds. For financial futures, including currencies, the CFTC uses different trader groups in its Traders in Financial Futures report. Participants in these markets may hedge risks as well; the classification simply differs from that used for commodities.
The 26 markets in Futures Insights 2.0
Futures Insights 2.0 groups 26 futures markets into eight classes. The Free Plan gives you gold (GC) with all indicators; paid plans unlock all 26 markets.
- GCGold
- SISilver
- PLPlatinum
- HGCopper
- CLWTI crude oil
- HOHeating oil
- RBGasoline
- NGNatural gas
- LELive cattle
- HELean hogs
- 6EEuro
- 6BBritish Pound
- 6JJapanese Yen
- 6AAustralian Dollar
- 6CCanadian Dollar
- ZCCorn
- ZWWheat
- ZSSoybeans
- ZMSoybean meal
- ZLSoybean oil
- KCCoffee
- CCCocoa
- CTCotton
- SBSugar
- ESE-Mini S&P 500
- VXVIX future
Your path to structured swing trading
Calm, efficient and grounded.
In our swing trading programme, you learn to use CoT data, seasonality and price dynamics deliberately—with a clear, adaptable framework rather than rigid strategies.
It is aimed at people who want to understand trading thoroughly and develop their approach over time.
Final thoughts
CoT data show past group positions. In historical context, they can inform a market view, but they confirm neither an entry nor a future price direction. A trading decision still needs your own rules and a suitable setup.
If you want to use CoT data, seasonality and other factors in a structured process, you can learn more in our swing trading programme.
Simon and the TradeNeon Academy team
Free · no credit card · upgrade anytime


When is COT data released?
The regular release is Friday at 3:30 p.m. US Eastern time and describes open positions as of Tuesday. Holidays or exceptional circumstances can change the schedule.
Is COT data an entry signal?
No. It describes past group positions. Entry timing, price and risk must come from your own method.
Was the Legacy Report discontinued?
No. The CFTC still publishes both Legacy and Disaggregated reports. They group traders differently.
Does it show what a particular major trader plans to do?
No. It shows aggregated positions and categories, not the intention or strategy of an individual participant.