
Fibonacci in trading:
Method, not magic

Fibonacci lines express an observed price move in percentages. They can help you mark areas where a pullback may deserve attention. The sequence cannot tell you whether the market will react there. Your chosen swing, market context and risk plan still matter.
A spiral illustrates proportions; it cannot forecast the next price.Image: TradeNeon
Not a market oracle.
Fibonacci sounds like a name from an old book of spells. Behind it is a number sequence that has interested mathematicians for centuries and is also used in trading.
Anyone looking at chartsVisual representations of prices over time, such as line or candlestick charts. will eventually encounter horizontal lines at 38.2% or 61.8%. They look precise and are intended to show possible pullbacks within a price move. But where do these numbers come from? And what can a line really tell you about the next trade?
This article explains how the Fibonacci sequence works, which tools have been built from it and how to use a Fibonacci retracementA Fibonacci retracement divides a selected price move between a high and low into percentage pullback levels. on a chart. The original chart examples show both the choice of a trend move and common mistakes. The mathematical ratios are clear; whether price reacts at a level is a separate question.
A Fibonacci retracement measures how far price has moved back through a selected earlier move. Its lines are areas to observe, not support levels that work automatically or trading signals on their own.
The Fibonacci sequence
The Fibonacci sequence begins 0, 1, 1, 2, 3, 5, 8, 13, 21. From the third term on, each number is the sum of its two predecessors: 3 + 5 = 8, followed by 5 + 8 = 13. Leonardo of Pisa, known as Fibonacci, popularised the sequence in Europe in his 1202 book “Liber Abaci”. The idea had been described earlier in India.
The ratios become interesting: 3 divided by 2 is 1.5; 5 divided by 3 is about 1.667; 8 divided by 5 is 1.6, and 13 divided by 8 is 1.625. Farther along the sequence, the ratio of consecutive numbers approaches the golden ratio, about 1.618. Reverse the ratio and you obtain about 0.618. Numbers two or three positions apart produce approximately 0.382 and 0.236. That is the mathematical origin of the familiar percentage levels.
A spiral can be drawn from adjoining squares and quarter circles. Similar shapes occur in some shells and plants. The drawing illustrates proportions. It does not show that every natural spiral follows the golden ratio exactly or that market prices obey it.

What a retracement measures
Many traders use these ratios as a grid for corrections within a trend. A retracement tool connects a selected low and high, or the other way around, and divides the price range into percentages. After a rise from 100 to 120, a 50% pullback lies at 110; a 61.8% pullback at 107.64. These levels describe distance from the high. The calculation cannot tell you whether price will reach or reverse at either one.
50% is half the move, but is not a ratio from the Fibonacci sequence. Some traders add 75% as another round number. The 78.6% level is approximately the square root of 0.618 and has become a convention in many charting tools. So 75% and 78.6% are different; neither is automatically the “last” valid pullback before a trend breaks. Which lines a platform displays depends on its settings.
What do the lines mean in practice? In an uptrend, a 23.6% retracement describes a shallow pullback, 38.2% a larger one and 61.8% a deeper one. This tells you only how much of the selected move price has given back. It says nothing about the strength of the trend or the chance that it will continue. Change the starting point and the prices of all percentage levels change too.
The earlier “league system” ranked 61.8%, 38.2% and 23.6% by presumed attention. That does not establish a ranking of how prices react. Nor is there evidence that institutional traders or algorithms generally cause higher volume at these levels. A commonly watched area may be part of a market observation; its hit rate and practical value have to be tested for the market and rules in question.
Sometimes a response at a widely watched level is explained as a self-fulfilling prophecy. To support that explanation, we would need to know how many participants chose the same trend leg, settings and trading direction. Even 75% and 78.6% produce different prices. An earlier high, news or liquidity may also be nearby. A price response close to a Fibonacci line cannot, on its own, identify what caused it.
The origins of 61.8%, 38.2% and 23.6% can be calculated. The claim that these particular lines hold more often or cause reversals is an empirical one. It does not follow from the sequence.
TradingView describes the calculation from two extreme points; CME explains retracements and extensions as technical-analysis tools.
Retracements, extensions and time zones
The retracement is the central Fibonacci tool. You select a high and low on the chart; the platform draws the chosen percentage levels between them. In an uptrend, that usually means a move from low to high, and the reverse in a downtrend. You can often adjust the lines yourself. They mark areas worth watching, not entries at the press of a button.
Extensions project arithmetic levels beyond the original high or low. Common examples are 161.8%, 261.8% and 423.6%, each relative to a selected prior move. Traders use them, for example, to assess possible target areas after a breakout. An extension is not a price target with a known probability.
Fibonacci time zones transfer distances from the sequence to the time axis rather than price. They can mark windows to observe, but do not predict a turning point. One retracement is usually enough to learn the method: decide in advance which move you are measuring and why its high and low fit your approach. Move the anchors later and every line changes.
Assessing an area on your chart
Step 1: Identify the trend. Before drawing levels, check whether the market shows a recognisable move followed by a correction. Without a justified trend leg, almost any two highs and lows can produce a grid. Record the period and market phase you are examining.
Step 2: Connect two points. In an uptrend, draw from low to high; in a downtrend, from high to low. The original article included candle wicks when choosing the extremes. Select prominent points that were visible before the potential reaction, and check how your platform displays the percentages.
Step 3: Watch the response. As price approaches an area, you can examine price behaviour, market structure and volume. An existing support or resistance areaA price area where buying or selling was previously visible. It may matter again, but does not have to., a volume profileDisplays traded volume by price area rather than by time. It records past activity, not guaranteed future support. or order flow may add context. Higher volume at a line does not prove that the Fibonacci number caused it.
The Academy original also mentioned auction speed and order-flow signals as possible observations. They can describe current trading activity. They do not replace a rule for recognising a response: Is a touch enough, must a candle close, or should another price area confirm the move? Without that definition, the desired outcome can easily influence a later review.
Step 4: Decide how to act. Only a rule defined beforehand determines whether the observation becomes a trade: What confirms the idea, what invalidates it, where is the stop and how large may the position be? A stop orderAn order triggered when a chosen price threshold is reached. In fast markets, execution can differ from the trigger price. and appropriate position size belong in that plan. A line alone is not a confirming signal.
The original example shows the S&P 500 E-mini future (ES) in 2024. After a rise, a low at 5,849.75 and a high at 6,178.75 were connected. The earlier body text said 6,178.85, while the chart itself labels 6,178.75. The correction first touched areas around 38.2% and 50%, then price rose again. That is the sequence in this historical snapshot, not proof that these levels work in general.
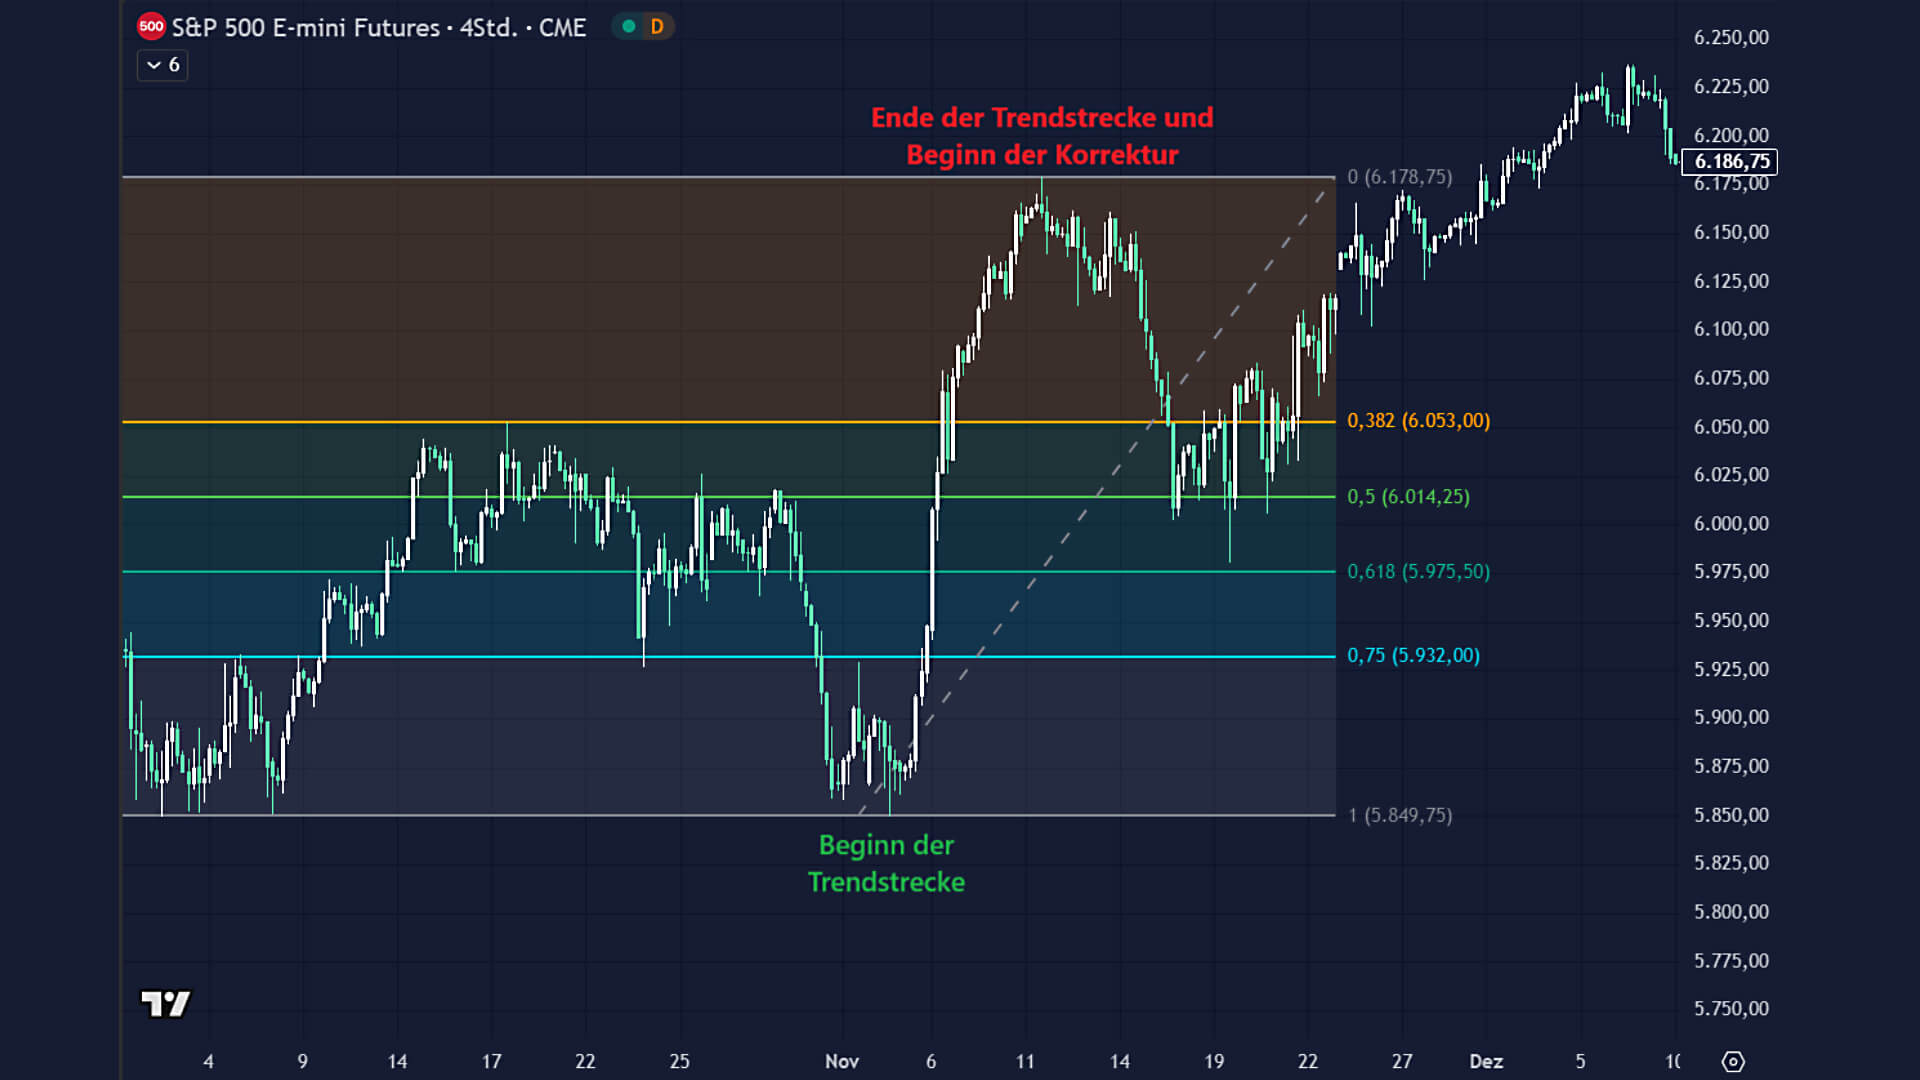
Why choose that low? It formed after a decline and a short sideways phase. Price then broke upwards quickly; the area had also been visible several times in October. Those are intelligible reasons for the anchor. The image cannot tell us whether everyone would have chosen the same low beforehand. Selecting the range only after seeing the subsequent reaction turns a fit in hindsight into a false forecast.
The high was a prominent extreme in the period shown. The low, by contrast, was an interim low within the larger uptrend. That is why the reasoning behind both anchors matters more than how neatly the lines appear on the chart. Another defensible start to the move would have produced different retracement prices. The image shows how to discuss a choice; it cannot settle it once and for all.
Three common mistakes
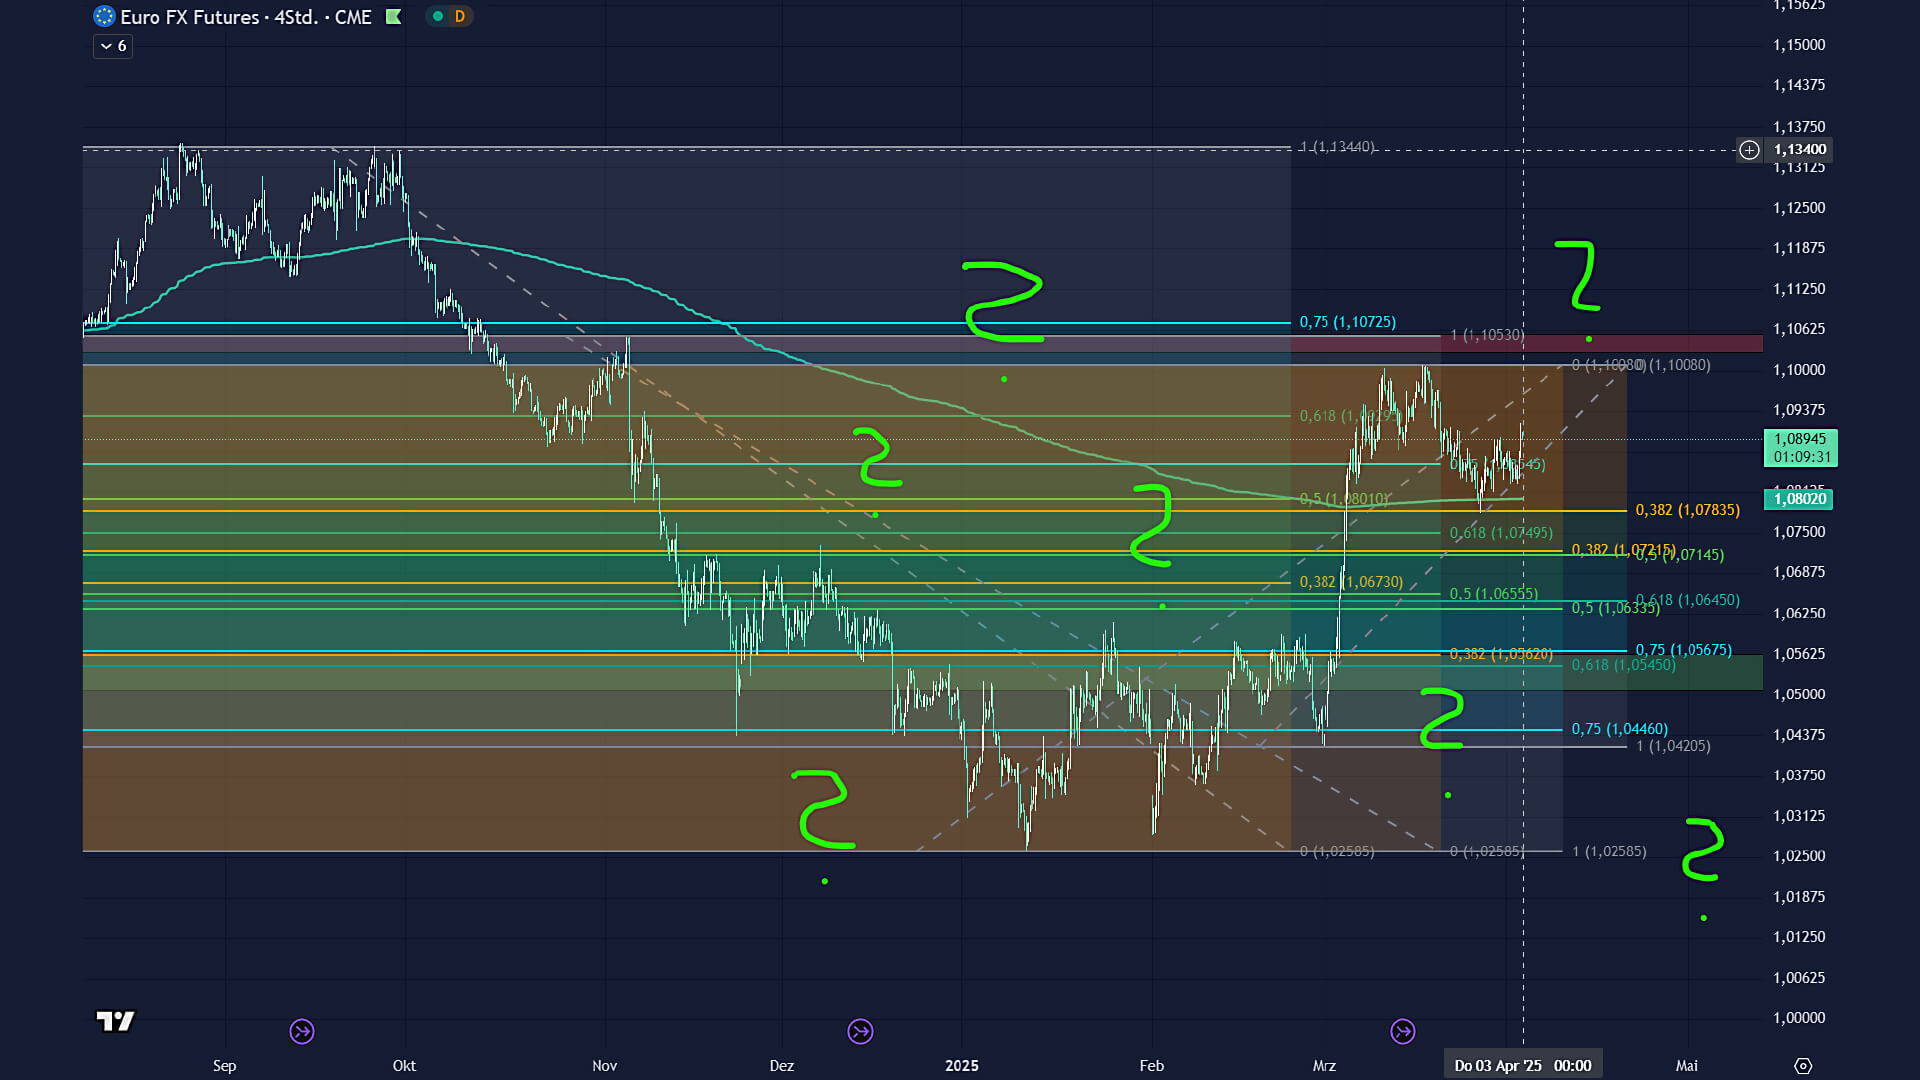
Mistake 1: Too many retracements. Measuring different moves and timeframes at once creates a tangle of lines. Some level will almost always be near the current price. The original Euro FX futures image shows just that overlap: several coloured grids and numerous possible “hits”. For an analysis you can assess, focus on one or two justified moves.
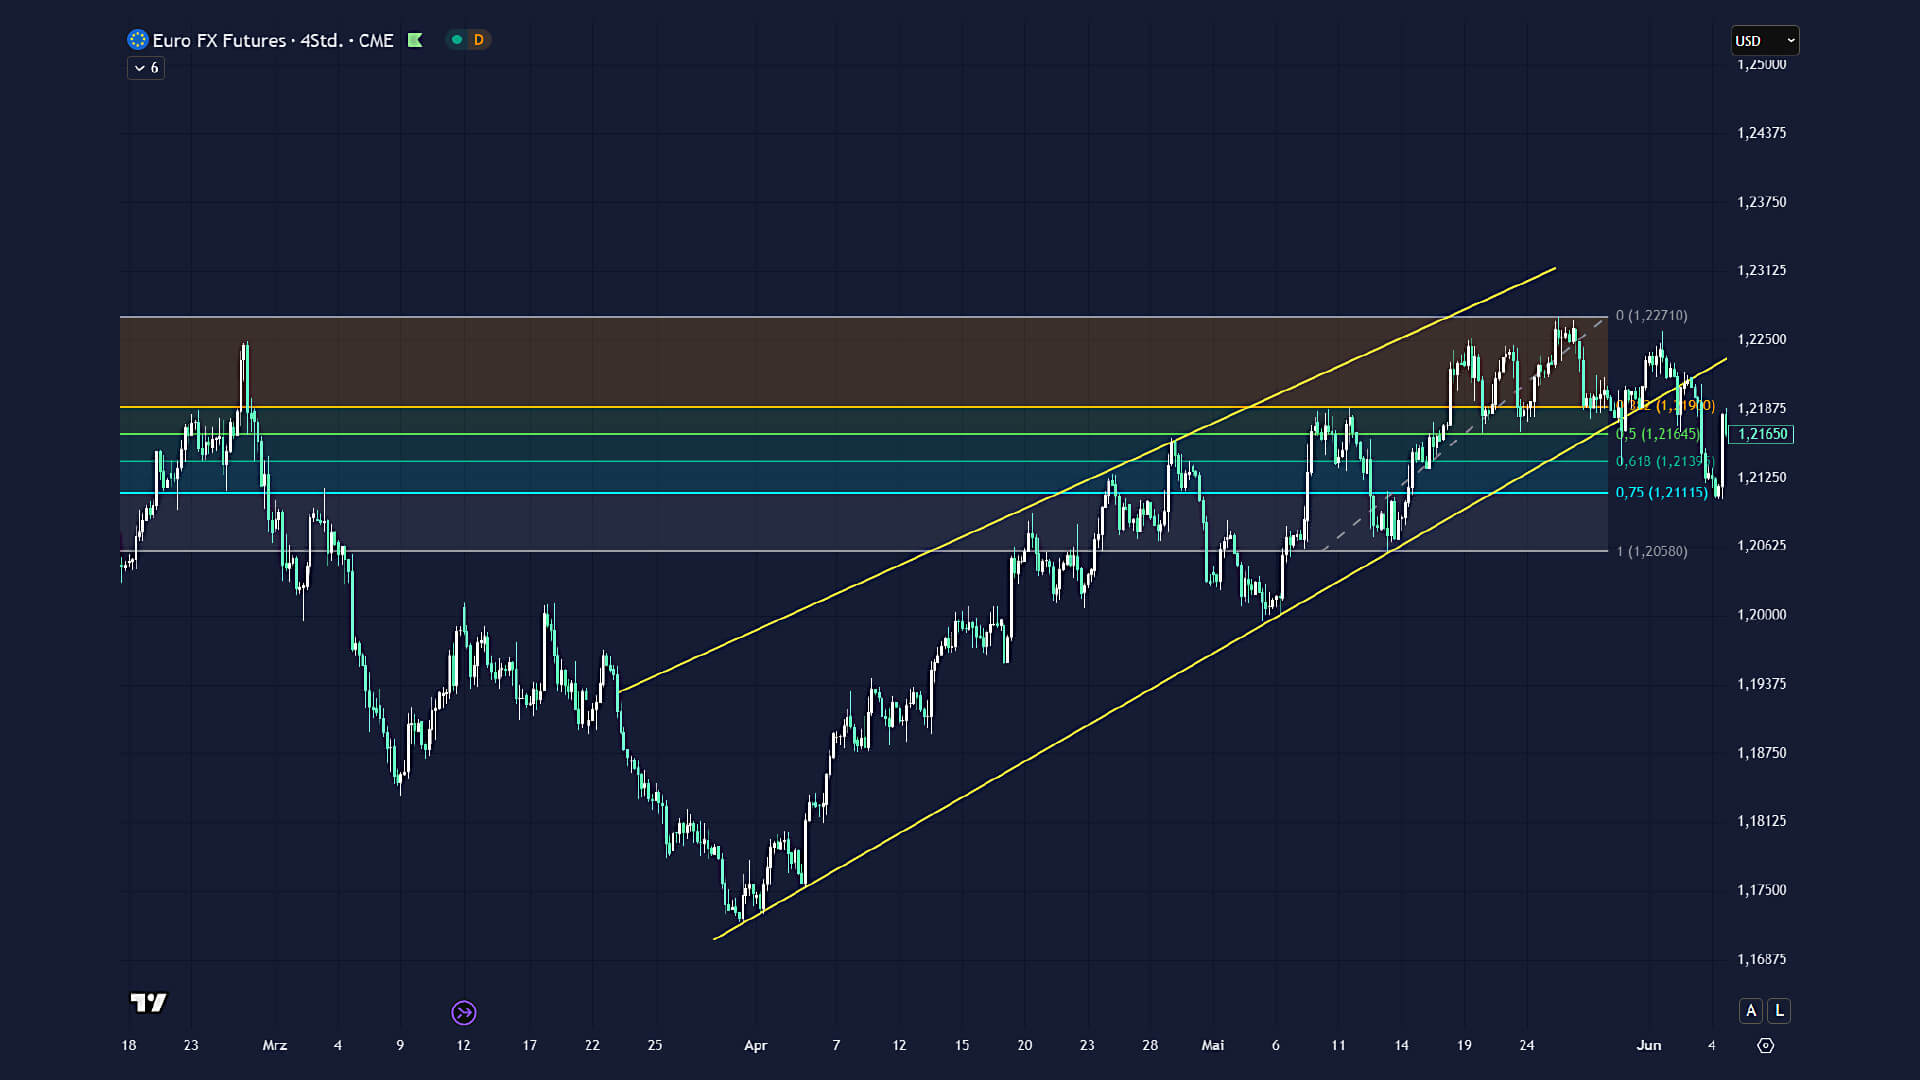
Mistake 2: Unclear highs and lows. A retracement always measures only the range you select. Small interim moves produce different lines from a prominent swing. The second Euro FX futures image shows a single grid within a longer price history. It invites the question of whether the chosen points fit the move under study. Clear selection rules recorded beforehand matter more than an apparently perfect match in hindsight.
That does not mean there can be only one permissible high and low on an entire chart. Different timeframes may justify different trend legs. Keep them distinct, though: Which question does the daily chart answer, and which the four-hour chart? Changing the timeframe after a losing trade can let a fresh grid hide the mistake rather than explain it.
Mistake 3: Relying on Fibonacci alone. A touch of 61.8% is not a complete trading decision. Check whether market structure and other observations fit the idea, and define entry, invalidation, exit and risk. Even a confluence of indicators is not yet a demonstrated edge. Only an evaluation of many cases traded under the same rules can show whether a method holds up.
Where Fibonacci fits in a trading method
Fibonacci is no miracle cure and no system that does the work for you. It can help you describe a price move deliberately: Where did it start, where did it end, and how deep was the correction? Above all, the method makes you state your chosen anchors and areas of interest openly.
That makes it useful as part of an analysis. It does not turn possible reversal areas into predictable turning points. A pullback may touch a line, move through it or turn before reaching it. You see the market's response only as it develops. Swing tradingAn approach in which positions are commonly held for several days to weeks to participate in medium-term price moves. offers a longer timeframe for this observation, but no automatic advantage from Fibonacci.
If you want to develop your own approach, define in advance which market phase, trend leg and confirmation you seek. Record when the idea would be invalidated, too. Then review losing trades, costs and different market phases. That lets you examine whether a rule is repeatable instead of collecting only charts that worked out.
In its swing-trading programme, TradeNeon places retracements in a specific Fibonacci system for futures and a wider process of market analysis, system rules and risk management. Other trading approaches exist as well; there is no universal single system. The complete process matters more than one percentage line. The programme is currently offered in German.

What does 61.8% mean in Fibonacci trading?
It is approximately the reciprocal of the golden ratio. In a retracement, it marks 61.8% of the chosen earlier price move. It is neither a reliable turning point nor an entry signal.
Is 50% part of the Fibonacci sequence?
No. Half the move is a commonly added chart level, but not a ratio derived from the sequence.
Are 75% and 78.6% the same?
No. The latter comes from the square root of 0.618; 75% is a separately added level. Any level used should belong to a method defined beforehand.
Can I trade from Fibonacci lines alone?
A line only locates a point within a past price move. You still need rules for context, entry, invalidation, exit and risk.