Fundamental analysis for futures: Beyond the chart

Fundamental analysis for futures examines positioning, the contract curve and recurring seasonal patterns alongside price. Here is what each dataset can show, where its limits lie and why one number is never enough.
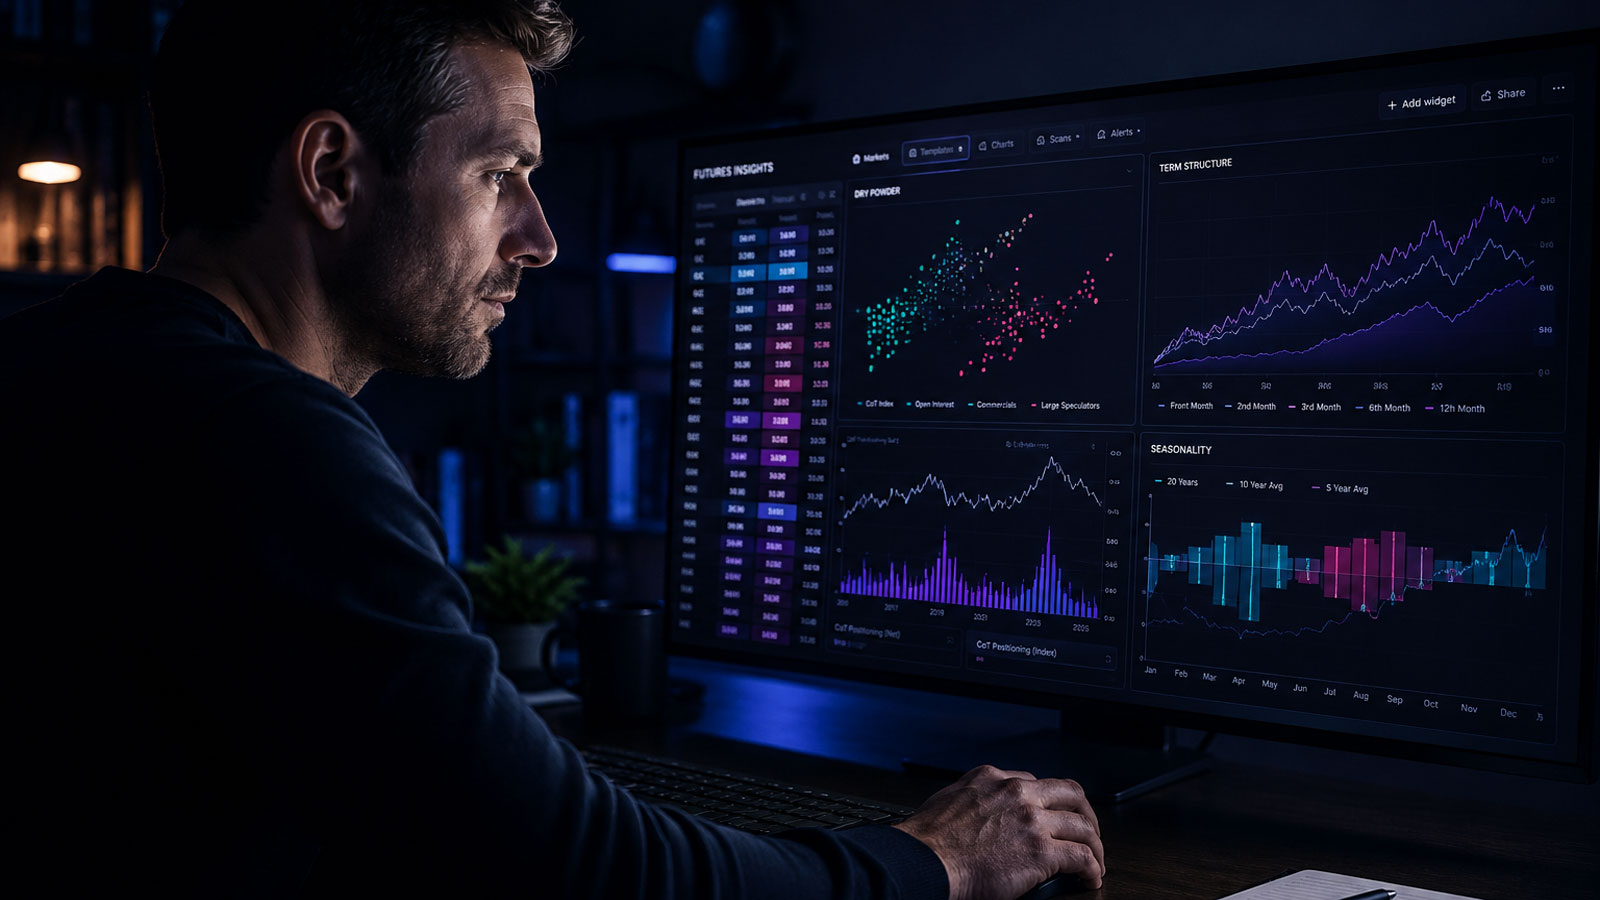
An editorial illustration of a trader reviewing market data; the screens are not a live Futures Insights view.Image: TradeNeon
One market hypothesis.
Most traders open a futures market and look at the same thing first: the chart. Price, candles, a moving average. That is technical analysis — and it is only half the picture. Fundamental analysis for futures asks a different question: what additional information might help explain this market beyond its price chart? For futures, those forces come down to three.
Technical analysis reads the chart. Fundamental analysis reads the forces behind it — for futures, that is positioning, supply and demand, and seasonality. Each one alone is a single dimension. Read together, they offer a structured view of a market. They do not determine the next price move.
In stocks, "fundamental" means balance sheets and earnings. Futures have none of that. Here, fundamental means the real forces of the market itself: who is positioned and how, whether physical supply is tight or abundant, and where the market sits in its seasonal cycle. The datasets can add context to the chart, though none identifies the cause of a price move on its own.
None of this is opinion data. Positioning comes from the CFTC’s public weekly Commitments of Traders report. It generally records Tuesday positions and is released on Friday, so it is not a live positioning feed. The contract curve compares traded futures maturities; seasonality studies historical prices. The work is reading these different datasets together, with their limits in view.
Positioning — the Commitment of Traders data
The CFTC publishes a weekly breakdown of reportable positions in covered futures markets. It shows aggregate positions by trader category, not the identity, intention or next trade of any participant. A positioning extreme deserves investigation; it does not establish when, or whether, a market will turn. CFTC explanatory notes describe what the reports include.
The report splits positions into categories, and the split is the point. In the legacy report, commercial and non-commercial are reporting classifications, not labels for "informed" and "uninformed" traders. The disaggregated report separates producers, swap dealers, managed money and other reportables in physical commodity markets. Non-reportable positions are grouped separately; they cannot simply be equated with retail traders. The headline net number hides these distinctions, so read each category in context. CFTC category definitions.
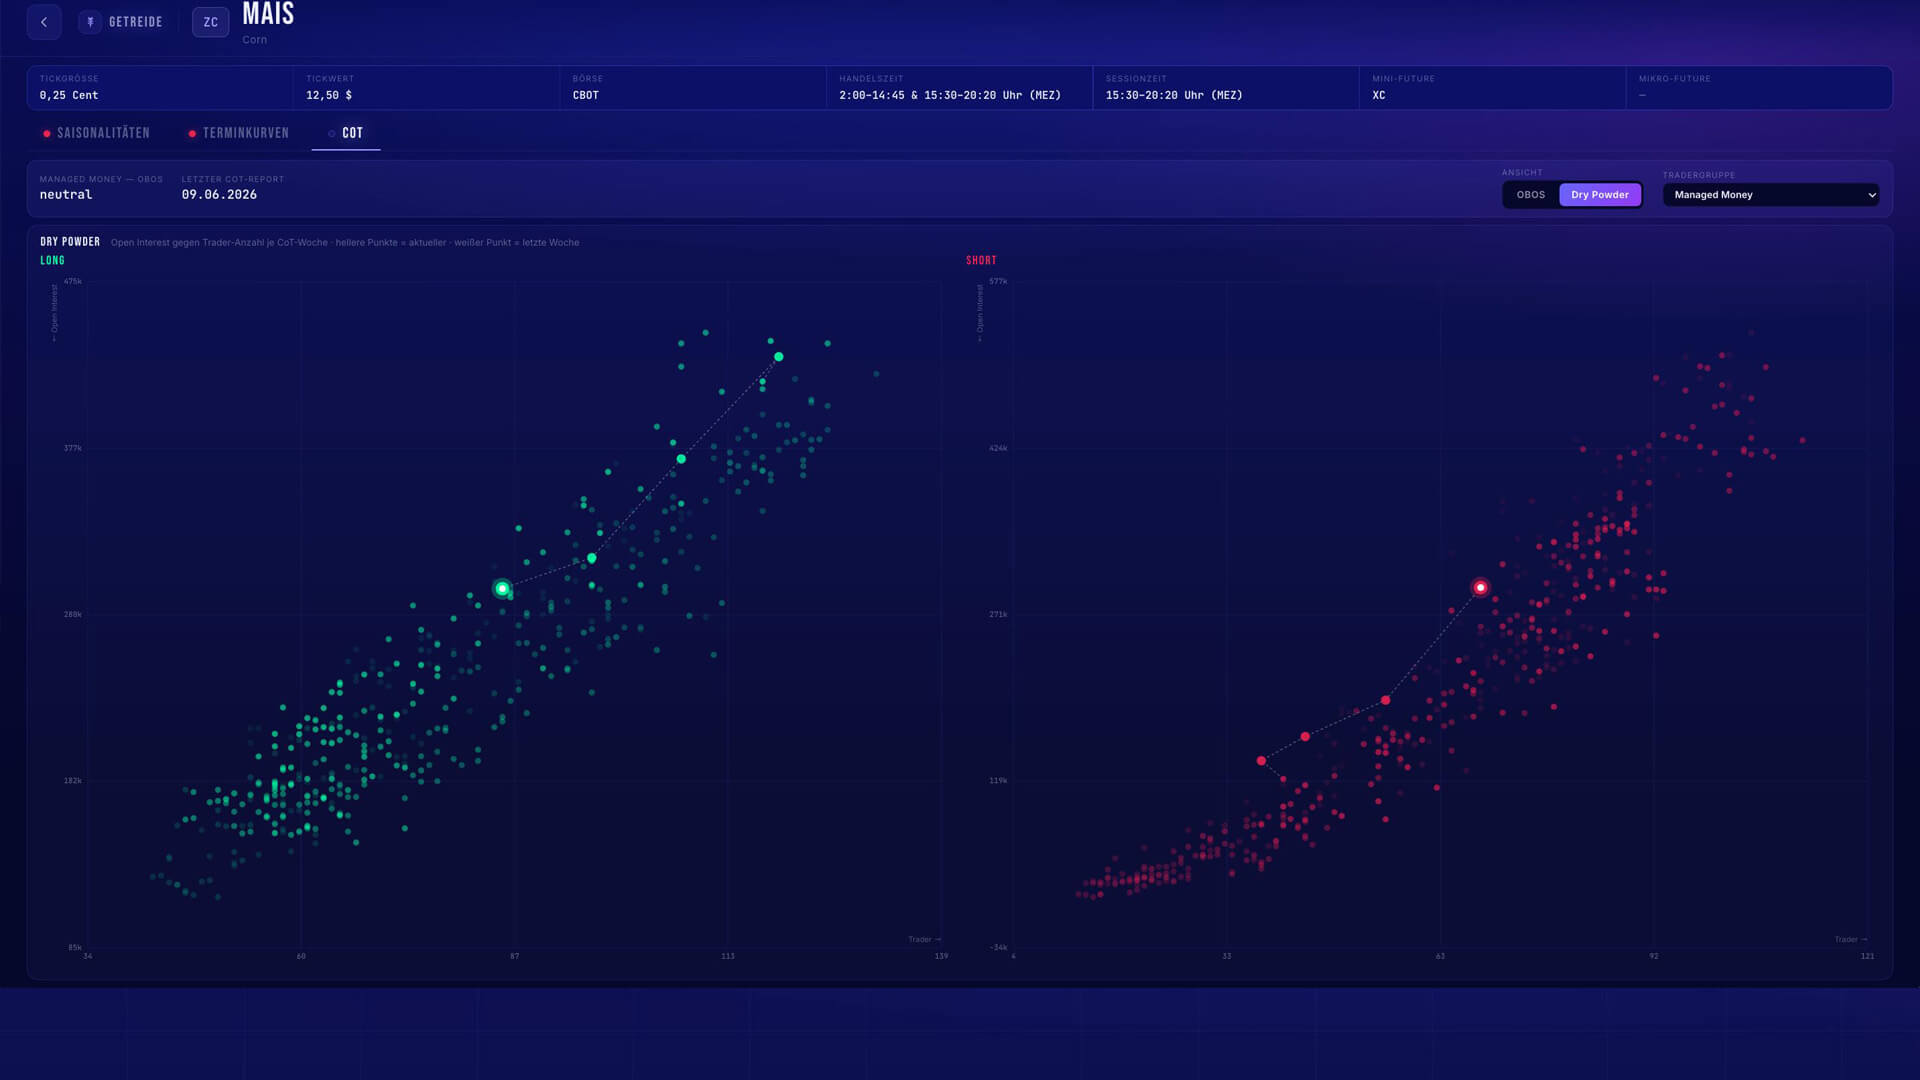
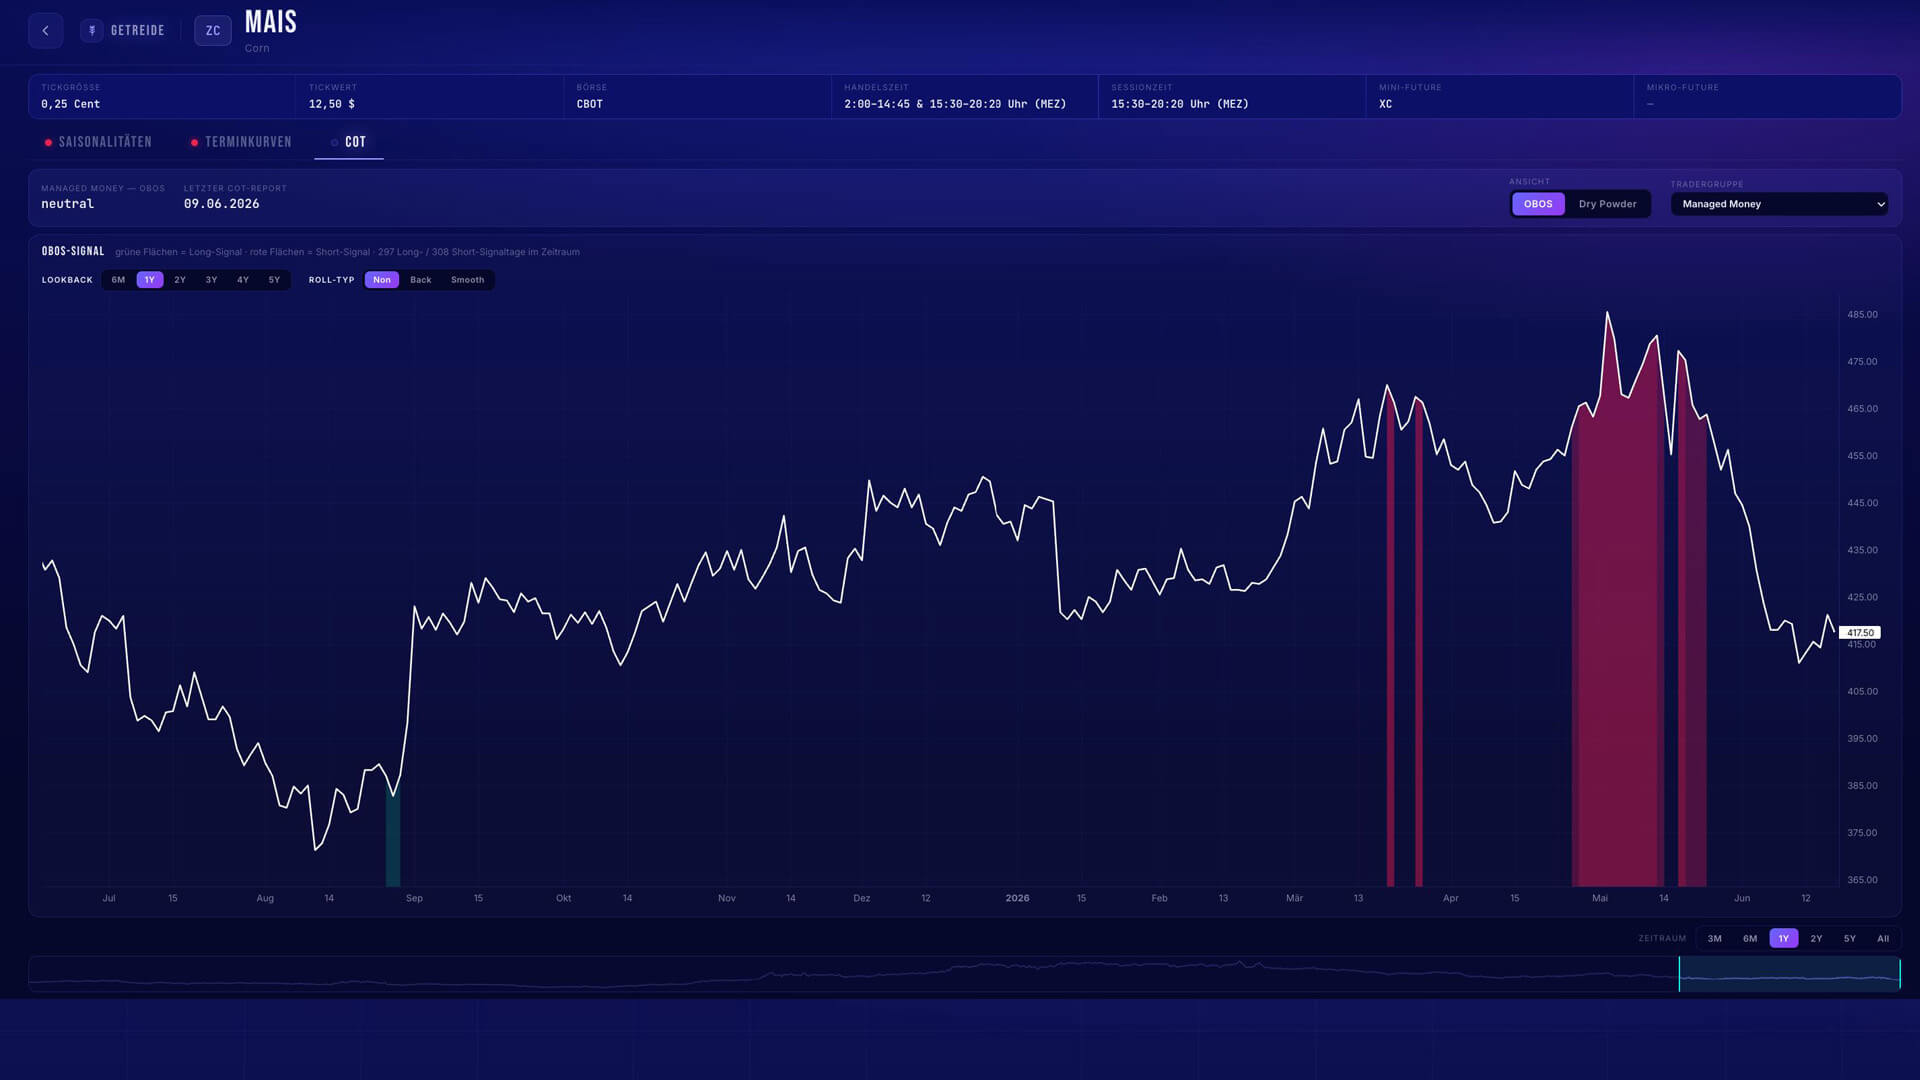
The raw report is dense, and the value is not in the headline net number — it is in reading positioning in context, against the open interest and against the extremes of previous years. Futures Insights does exactly that, and turns the CoT data into two reads:
- Dry Powder — how much "unused powder" is ready at the market, built from open interest and the number of traders. It is a measure of fuel for the next move — not the absolute size of anyone's position.
- OBOS — overbought / oversold. It sets current positioning against open interest and prior-year extremes, normalised into a clear over- or under-bought reading.
Common mistake: reading "commercials are short" as automatically bearish. Positioning is context, not a trigger — an extreme tells you the market is stretched, not that it turns tomorrow. Read our detailed CoT guide.
Supply and demand — the term structure
A futures market has contracts with different delivery months. When nearby contracts trade above later ones, the curve is backwardated; when later contracts trade above nearby ones, it is in contango. Its shape can reflect supply and demand, storage, financing and other carry factors. It is useful context, not a one-to-one measure of physical inventory. CME Group explains both curve shapes.
Front month higher. Later contracts cheaper; one possible sign of near-term tightness.
Front month lower. Later contracts dearer; carry costs can contribute.
Futures Insights evaluates the curve using a Z-score — how unusual its current reading is relative to its own history — and Z-momentum, which shows how that reading is changing. These indicators can flag a change in the curve; they cannot establish that the outright futures price will turn or that a trade has an edge.
The curve is formed by market participants trading different delivery months. For physically delivered commodities, storage, insurance, financing and the value of immediate availability can all matter; their relative importance differs by market. In Gold, for example, financing and location can affect spreads. Treat a curve change as evidence to examine alongside other data, not as proof of a coming price reversal. CME on carry and convenience yield.

Common mistake: reading contango as "bearish price". The curve can reflect supply and carry conditions, but it is not a price forecast — a market in contango can still rise.
Cycles — seasonality
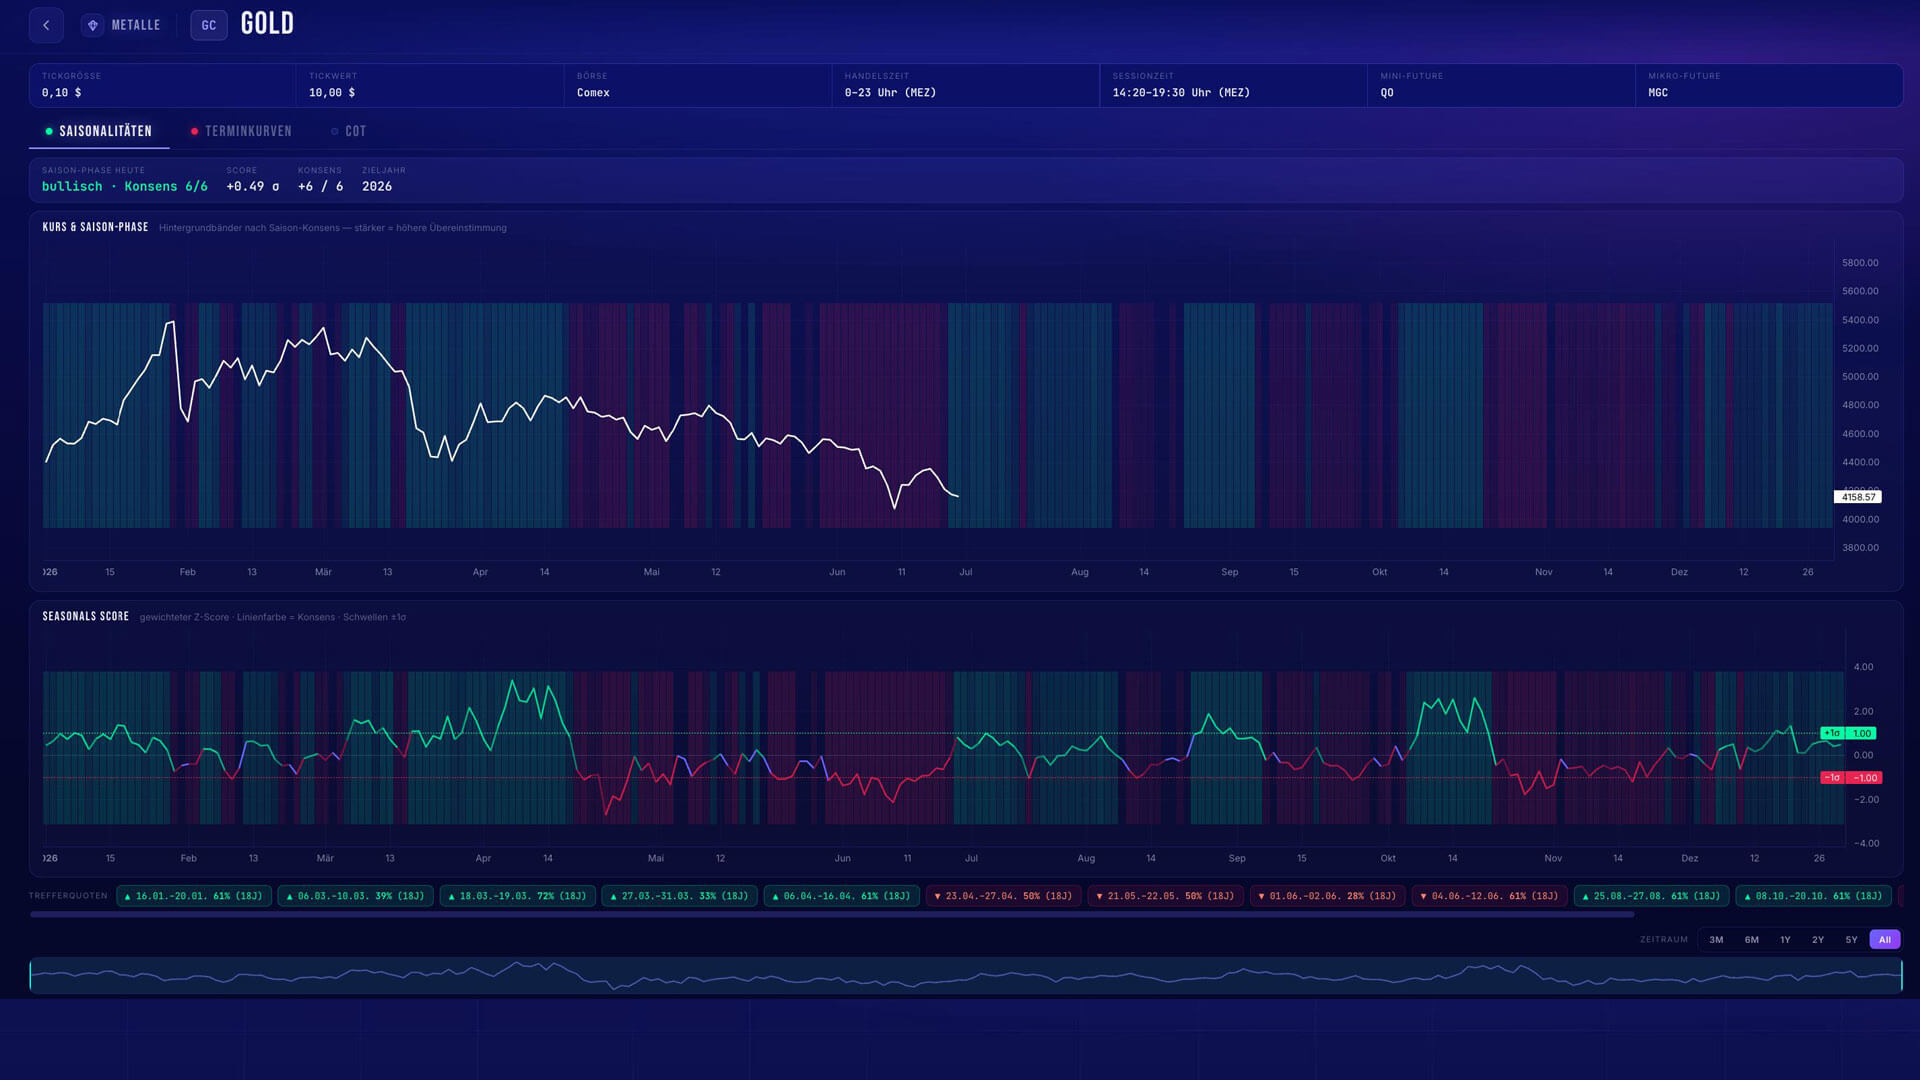
Many futures markets follow recurring real-world rhythms: harvests, heating season, refinery turnarounds. Seasonality asks whether the calendar is currently a tailwind or a headwind. Futures Insights weighs many years of price history into a weighted seasonal score — and, just as important, shows consensus bands: how much the individual years actually agree on the current phase.
That agreement is the whole game. A seasonal average drawn over twenty years can look like a clean tailwind even when half of those years actually fell — the line is just the mean of a disagreement. Futures Insights treats a season as active only when enough years line up the same way, and it shows you that spread directly. An agreed historical pattern can carry more weight in the tool; a noisy one can be set aside. Neither is a forecast.
Common mistake: trading a seasonal average blindly. An average over disagreeing years is noise — historical agreement matters more than an average curve alone.
What a single CoT chart can't do
A classic CoT index scales commercial positioning across a chosen historical lookback, often as a 0–100 oscillator. Formulas and lookback windows vary. It shows one aspect of positioning, rather than the term structure or seasonal history. The underlying CFTC report supplies positions, not a ready-made CoT-index score.
Futures Insights keeps that positioning read — and adds the dimensions a single chart leaves out: OBOS and Dry Powder from the same CoT data, plus term structure and seasonality. The result is a finished sentiment read per market, across 26 markets on one dashboard. The value is breadth and a consistent analysis workflow, not a trade signal. Whether it helps a trading strategy requires testing; Futures Insights cannot promise an outcome.
Why one number is never enough
Each force alone is a single dimension — and one dimension is easy to over-trust. A positioning extreme deserves a closer look if the curve and seasonal record point the other way. Agreement can make a hypothesis more coherent, but it does not prove an edge; disagreement may be a reason to wait or investigate further. Doing that by hand across dozens of markets every week is the work that stops most traders from using fundamentals at all. That is the job we built Futures Insights to do.
| What the three forces show | How to read it |
|---|---|
| All three agree | All three agree. A coherent hypothesis to investigate on the chart; no automatic entry. |
| Two of three agree | Mixed evidence. Check the disagreement and your own trading rules. |
| The forces conflict | No clear combined view. Waiting may be appropriate. |
What fundamental analysis for futures is not
It helps to be clear about the boundaries, because "fundamental" gets stretched in a lot of directions:
- Not a signal service. A fundamental read tells you whether a market deserves attention and on which side — it never tells you to buy at a price with a stop and a target. You keep the decision.
- Not a crystal ball. It can help form a market hypothesis; it does not establish a profitable edge or predict the next candle. An extreme can stay extreme.
- Not stock fundamentals. No earnings, no balance sheets. For futures it is positioning, physical supply, and cycles — the real forces of the contract itself.
Reading one market: a worked example
Take Gold as a hypothetical illustration, not a current market reading. Suppose positioning is near a multi-year extreme, the contract curve turns backwardated and historical seasonality points in the same direction. The agreement gives you a hypothesis to investigate on the chart. It does not prove physical scarcity in Gold or establish that a long trade will work. CME explains why carry factors also shape the curve.
Now flip one force — say the season turns to a headwind. The picture gets murkier, and that is useful: you can examine the disagreement or wait for more evidence. Fundamentals do not remove your judgement, and agreement does not guarantee a favourable trade.
Fundamental vs. technical — not either/or
These two are often framed as rivals. They are not — they answer different questions. Fundamental data can help you decide which markets deserve attention and shape a directional hypothesis. Chart analysis can help with timing, entry and risk. Used together, they give different kinds of evidence; neither replaces your strategy or risk rules.
Frequently asked
Is Futures Insights a signal service?
No. It reads the fundamental forces and shows a context read — long, short, or neutral — per market. It never tells you to buy or sell at a price. The decision stays with you.
Do I have to read the CoT report myself?
No. Futures Insights uses weekly CFTC positioning data to calculate Dry Powder and OBOS across its markets. The underlying report is published after the Tuesday snapshot, generally on Friday. CFTC release schedule.
Which markets does it cover?
26 futures markets across eight sectors — metals, energy, grains, softs, meats, currencies, an equity index (ES) and volatility (VIX).
Does fundamental analysis replace technical analysis?
No. Fundamentals tell you whether and which side; technicals tell you when and where. They work best together.
Can I try it for free?
Yes. The Gold market is free on the Free Plan — no credit card required.