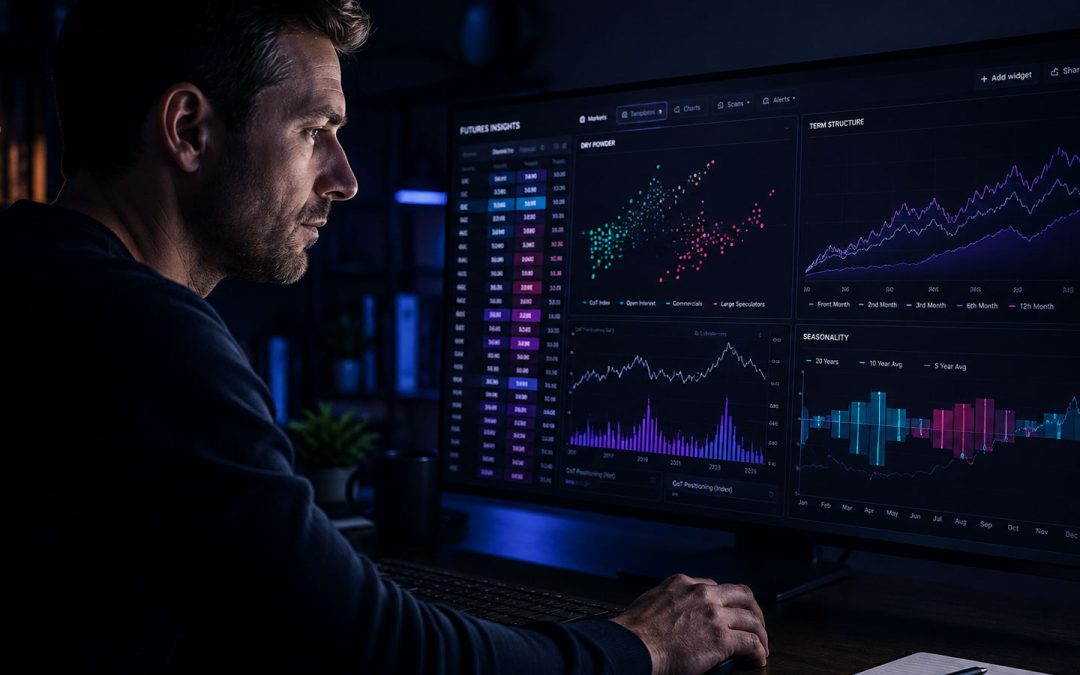
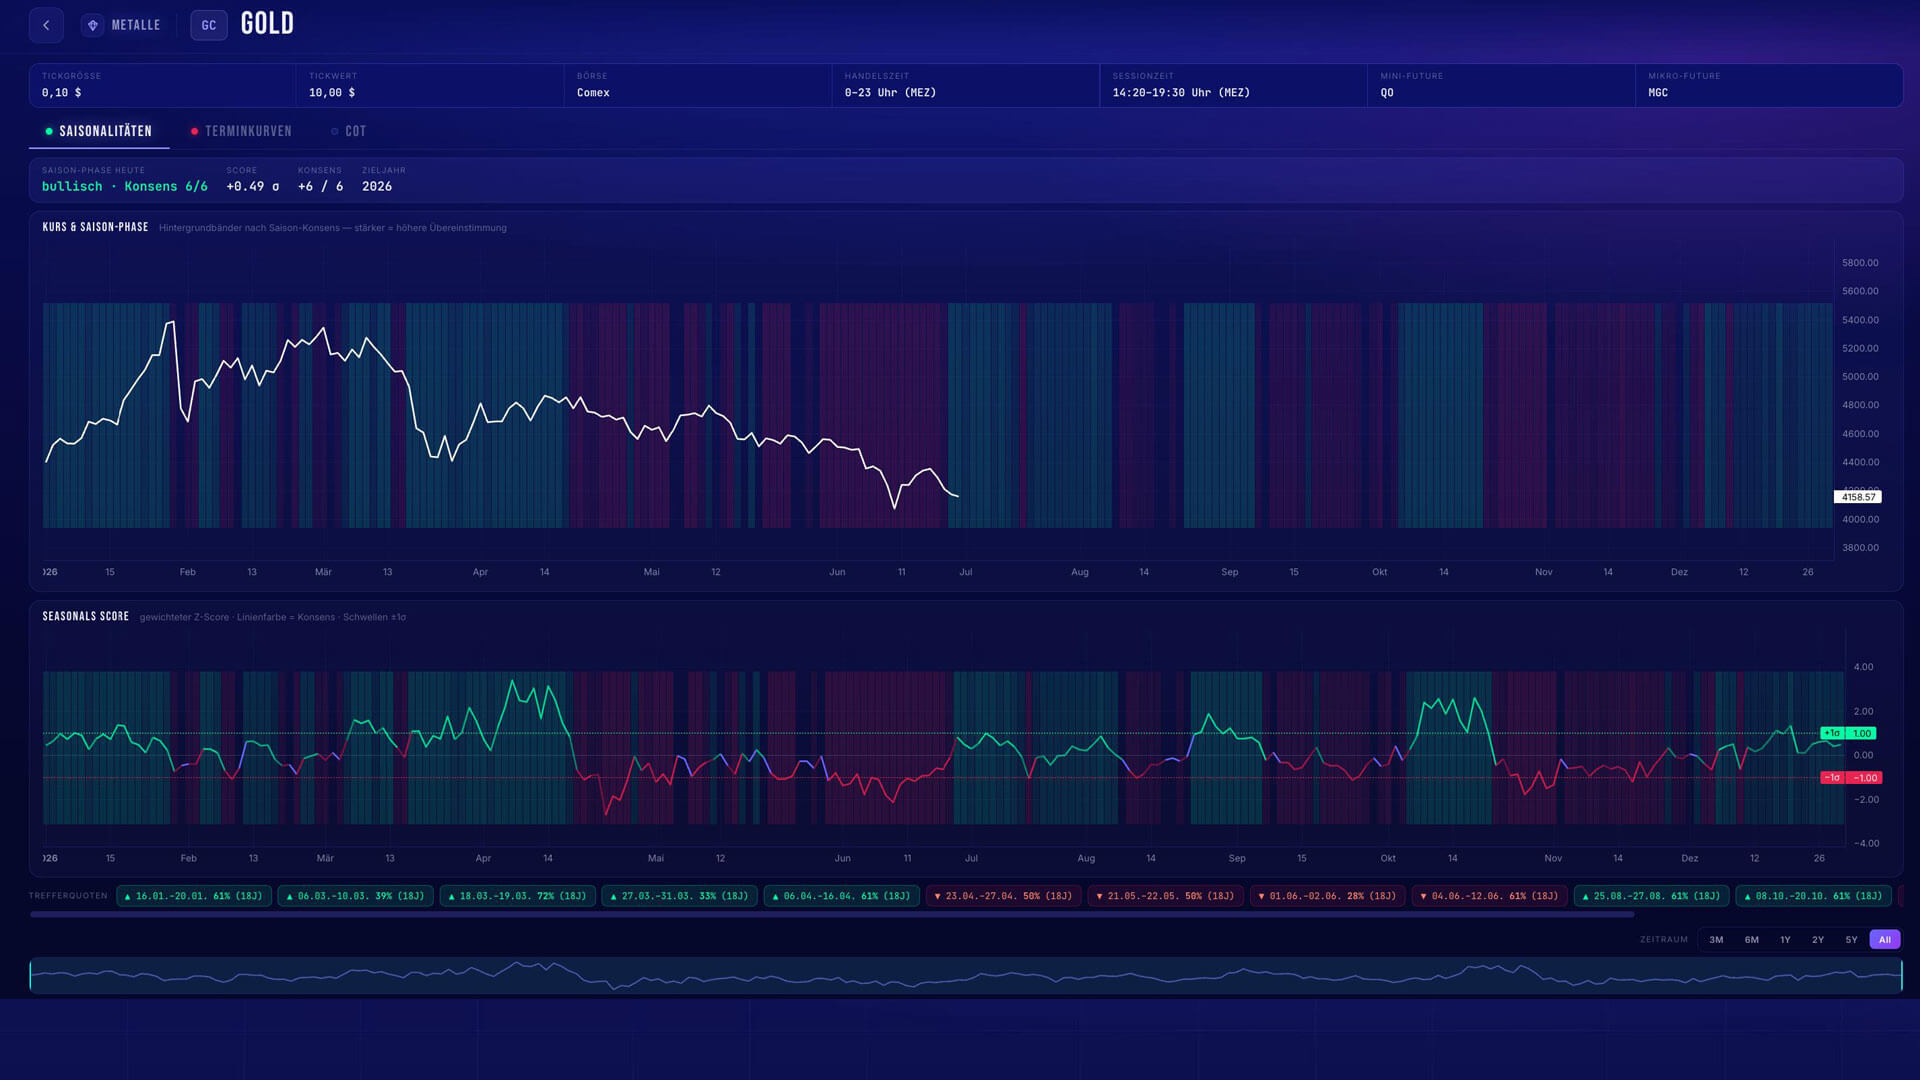
Futures Insights (FI) is TradeNeon's web-based analysis software for futures traders. It brings together COT data, seasonality and term structure in one view. You can identify markets worth a closer look and compare the fundamental picture with your own setup.
FI in focus: an illustration based on the gold seasonality view. The image tour contains original English software captures.Image: TradeNeon
Three fundamentals for your futures analysis
Show contents
01
What do you use Futures Insights for?
You open the COT data, check a seasonal curve and compare prices across futuresA future is a standardized forward contract that obligates the trading partners to a transaction in the future. contract months. Each view answers a different question. The real work starts when you bring them together: Does the seasonal pattern fit current positioning? Does the term structure support your assessment? Or do the data disagree?
This is where Futures Insights fits in. The software brings these three perspectives together. Its dashboard covers 26 futures markets across eight sectors. From the overview, you can open an individual market's detail view and examine how its assessment is formed.
FI is mainly for traders who swing trade or position trade futures or optionsThe buyer of an option pays a premium for the right to buy or sell a stock or a future at a fixed price and within a fixed period of time. on futures, thinking in days or weeks. It does not provide a trigger for entries measured in seconds. Its role is in preparation: Which markets deserve your attention today?
02
Three fundamentals, five indicators
FI calculates three fundamentals and displays them through five indicators. The data sources are COT data, seasonality and term structure. The indicators help you assess different characteristics of those data.
Explore FI · Gold (GC)
Switch between real software views. Use “Enlarge” to read labels and details.
Original capture · 23 October 2026
The upper view combines price and seasonal phases. Below it is the weighted Seasonals Score; line colour shows consensus.
Interactive tour of saved software views. Find current data in Futures Insights.
COT data: How are market participants positioned?
The Commitments of Traders reports from the US regulator CFTC show the open positions of different trader groups. They provide a view of a market's composition. What you see is aggregated positioning, rather than individual trading plans or intentions.
FI calculates OBOS and Dry Powder from COT data. OBOS stands for Overbought/Oversold and puts into context how one-sided each trader group's positioning is. Dry Powder incorporates open interest and the number of trading institutions holding positions. Open interest is the number of outstanding contracts.
An extreme reading does not tell you when a market will turn. COT data help you assess direction from a fundamental perspective. They are not a timing tool for trade entries.
COT data are not a live feed: The CFTC publishes traders' positions from the previous Tuesday every Friday, although holidays can change the schedule. FI's daily update does not change this rhythm. The CFTC explains the reports and their publication schedule.
Seasonality: What does price history show?
Seasonality examines recurring patterns over the course of a year. FI evaluates long-term price history and displays a weighted score. Consensus bands also show how closely the years examined agree on a seasonal phase.
This helps you distinguish an average shaped by several similar price paths from one influenced by a few unusual years. Current market conditions remain a separate question. Historical agreement does not promise the same outcome next year or establish a future win rate.
Term structure: How do contract months differ?
The term structure compares prices across delivery months in a futures market. When nearby contracts trade above later ones, this downward-sloping curve is described as backwardation. An upward-sloping curve, with higher prices for later contracts, is described as contango.
FI adds Z-Score and Z-Momentum to this analysis. Z-Score puts the value being examined into the context of its own history. Z-Momentum shows how that reading changes. You can assess the extent of a term-structure condition and its change separately.
The curve needs to be understood in the context of its market. For physically delivered commodities, factors can include storage, financing and the benefit of having the commodity available immediately. Contango therefore does not automatically mean oversupply; backwardation alone does not prove that prices are about to rise. CME explains the underlying factors.
03
What does the combined view add?
A COT indicator examines positioning. A seasonal curve shows historical patterns. The term structure compares contract months. In FI, you can examine these sources side by side and investigate their differences.
Consider a hypothetical example in gold: Seasonality points in a particular direction, positioning fits that assessment and the term structure appears consistent with it. This gives you a market hypothesis to examine further on the chart. It does not yet give you an entry.
If positioning contradicts the seasonal pattern, that difference deserves a closer look. You may put your assessment on hold, examine more information or choose another market under your rules. The software helps you organise these questions. Agreement between several readings does not establish a statistical edge or the profitability of a trade.
04
How does FI fit into your trading routine?
Start with the market overview and choose a market to examine. Open its detail view and ask whether positioning, seasonality and term structure form a coherent picture. Build a reasoned assessment, including the points that still argue against it.
Then apply your own trading rules: Is there a suitable setup? Where would you enter? What would invalidate the idea? What position size fits your risk? These decisions remain yours. FI provides the fundamental context; you define entry and risk limits through your trading rules.
Here, FI stands for Futures Insights, TradeNeon's web-based analysis software. It combines COT data, seasonality and term structure so you can consider the fundamental market environment in your futures analysis.
Which five indicators does Futures Insights include?
Dry Powder and OBOS are based on COT data. The other indicators are seasonality, plus Z-Score and Z-Momentum from the term structure. Consensus bands add context to the seasonal display; open interest is an input to the COT analysis.
Who is Futures Insights for?
FI is for swing traders and position traders who trade futures or options on futures. Its analysis supports the market overview and preparation. It is not a short-term timing tool for scalpingScalping is a very short-term trading approach in which positions are often held for only seconds or minutes..
Do I need to install anything?
No. Futures Insights is web-based and runs in your browser.
What is free in the Free Plan?
Gold (GC), with all indicators. Registration requires no payment details or credit card. You can open the Free Plan here.
Can Futures Insights make a trading decision for me?
The software supports your analysis. You remain responsible for the setup, entry, position size and risk. Subsequent price action can invalidate even an assessment in which the fundamentals agree.
Oliver Sparing
Founder & Head of Trading · TradeNeon
Oliver Sparing has been actively trading the financial markets since 2011. His professional roots lie in precious metals trading in Hamburg; in 2017 he learned at a London trading floor. At TradeNeon he leads the day trading and swing trading programmes and is responsible for the trading methodology, with a focus on order flow, market structure and fundamental market data. Level of Interest, Futures Insights and Lab of Trades grew out of this work. Platforms such as ATAS, Bookmap and WH SelfInvest regularly invite him as a guest. All guest appearances
Stock trading systems Rules, backtests and execution
Oliver Sparing
Founder & Head of Trading · TradeNeon
October 2026 · 8 min read
Which stocks do you consider? When do you enter a trade, how large should the position be, and when do you close it? A stock trading strategy gives these decisions a set of rules. Software can prepare the trades for you to review and approve yourself.
Assessing a trading system means examining its rules, test data and execution workflow.Image: TradeNeon · AI-generated illustration.
Assessing trading systems
Rules, test data and execution, illustrated by the Equity Growth System.
You do not have to write code or develop a system from scratch to use one. Using the Equity Growth System for US stocks, we explain how an existing approach works, how you approve trades in practice, and what to look for in its backtests.
01
Which decisions the rules cover
A rules-based strategy specifies the conditions under which trades are placed. These include the stock universe, entry and exit criteria, and position-sizing rules. The stock universe determines which stocks can be considered for a trade.
For an index-based stock strategy, the historical composition of that universe also matters: which stocks actually belonged to the relevant index when a historical trading signal occurred? Accounting for membership at that point in time is part of a properly constructed backtest.
To use a system, you also need to understand the trading routine. How long are positions typically held? How many can be open at once? When do you need to take action? These details help you assess the workload and risks involved.
02
Develop your own system or use an existing one
When you develop your own system, you define its rules, obtain and check historical data, and study how the rules behave in backtests. Implementing it also means deciding how a planned position becomes an order in your brokerage accountA broker is a securities dealer who executes transactions on the stock exchange on behalf of a client..
With an existing system, that development work has already been done. Before using it, you should understand how it was tested and which tasks remain yours in day-to-day trading. With EGS, the software prepares the trades; you review and approve them yourself.
03
What to look for in backtests
Assessing a stock strategy includes understanding how its results were produced. Two important criteria are the historical stock selection and the stability of the rules when parameters change.
Historical index membership and survivorship bias
Using today's index constituents for a backtest covering many years can distort the results. Companies that have since left the index are missing, while stocks added later may be included too early in the historical test. Looking only at the companies that survived is known as survivorship bias. This can make an equity curve look better than it would have with the stock universe available at the time. The QuantConnect research guide also explains this issue.
In our Equity Growth System backtests, we include only stocks that actually belonged to the strategy's index at the time of each signal. What matters is their index membership at that point in history.
Few parameters and checks for curve fitting
Curve fitting means adapting rules so closely to historical data that they also capture its random noise. A useful robustness test therefore examines how results change under different parameter settings. The IBKR Campus webinar on backtesting discusses the importance of such checks.
For EGS, we use robust stock strategies with few parameters. Even substantial changes to individual parameters would have left them profitable in the historical tests. This is an important feature of our approach: its results do not depend on a single finely tuned set of parameters.
04
What the Equity Growth System prepares for you
Lab of Trades → TitanEquity Growth System
The Equity Growth System is a rules-based approach to swing trading in stocks. Its rules are calculated internally. You can execute the resulting trades through Lab of Trades in your own brokerage account. You will find the Equity Growth System in Titan, its stock trading module.
The TradeNeon team has carried out the development work for these systems. The rules produce prepared trades that you can review and execute independently. In the software, you see the model portfolio with its positions and upcoming changes.
Positions are typically held for one to ten trading days. This is swing trading with positions held overnight. Price gapsWhen the closing price of a chart candle and the opening price of the next candle differ, a price gap arises between them. following news outside trading hours are among the risks of this approach.
05
How approval before the US market open works
To trade the system, you need a brokerage account enabled for US stock trading and Trader Workstation, or TWS. You also need Lab of Trades on your Windows, Mac or Linux computer.
The trades are available before the US market opens. You review them, manually approve each trade and send the orders from Lab of Trades to your TWS. The planned entry then takes place at the market open.
You can complete the approval beforehand, so you do not need to be at your screen at the exact opening time. Semi-automated means that the software prepares the trades while your approval remains necessary for each one.
06
How to interpret EGS backtests and real-money trading
Our team has traded these systems in their current form in its own real-money accounts for many years. This practical experience complements the historical tests and checks of the trading rules.
The curves shown on the EGS product page are labelled as historical backtests starting in 2000. They apply the rules to historical price data and include standard IB trading fees.
The equity curve shows the simulated performance. Below it is the drawdown: the decline from the previous peak. Together, they show how capital developed during the test and the setbacks along the way. The largest historical drawdown is not a limit on future losses.
In the chart below, you can switch between sizes S, M and L and view different parts of the test period. The accompanying notes explain how the results were calculated.
Past results from backtests and real-money trading are not a reliable indicator of future results.
Lab of Trades / Titan / Equity Growth System
EGS backtests
Loading data from the EGS product page.
–
Short periods show only part of the history.
Sharpe Ratio
Annualised return
Max. Drawdown
Backtest · hypothetical results, not actual trading
Each larger tier adds further systems and stocks. The sizes therefore differ in their underlying trading rules as well.
Size
Included systems
Maximum simultaneous open positions
S
One system for S&P 100 stocks
3
M
Everything in S, plus another system for S&P 500 stocks
8
L
Everything in S and M, plus a third system for Nasdaq 100 stocks
13
Alongside the backtests, consider the included strategies and the number of possible open positions. A larger package does not automatically mean a smaller drawdown.
08
Adding to your own strategies
If you already trade your own strategies, you can assess another systematic approach as a complement. The same applies to a long-term portfolio that you want to supplement with an active component. The practical benefit of an existing trading system is that you do not have to develop this additional approach yourself.
The EGS systems remain US stock strategies. How much additional diversificationThe term diversification refers to the spreading, or allocation of assets across different investment types, industries or economic regions. they offer depends on what you already trade and how the approaches behave together. More systems do not automatically mean less overall risk.
To get to know the software, you can use Lab of Trades on the Free Plan, including Smart Entry Equity on Mondays. The Equity Growth System itself is a separate paid subscription.
Swing Trading
Oliver Sparing
Founder & Head of Trading · TradeNeon
Oliver Sparing has been actively trading the financial markets since 2011. His professional roots lie in precious metals trading in Hamburg; in 2017 he learned at a London trading floor. At TradeNeon he leads the day trading and swing trading programmes and is responsible for the trading methodology, with a focus on order flow, market structure and fundamental market data. Level of Interest, Futures Insights and Lab of Trades grew out of this work. Platforms such as ATAS, Bookmap and WH SelfInvest regularly invite him as a guest. All guest appearances
Fundamental analysis for futures: Beyond the chart
Oliver Sparing
Founder & Head of Trading · TradeNeon
Updated October 2026 · 9 min read
Fundamental analysis for futures examines positioning, the contract curve and recurring seasonal patterns alongside price. Here is what each dataset can show, where its limits lie and why one number is never enough.
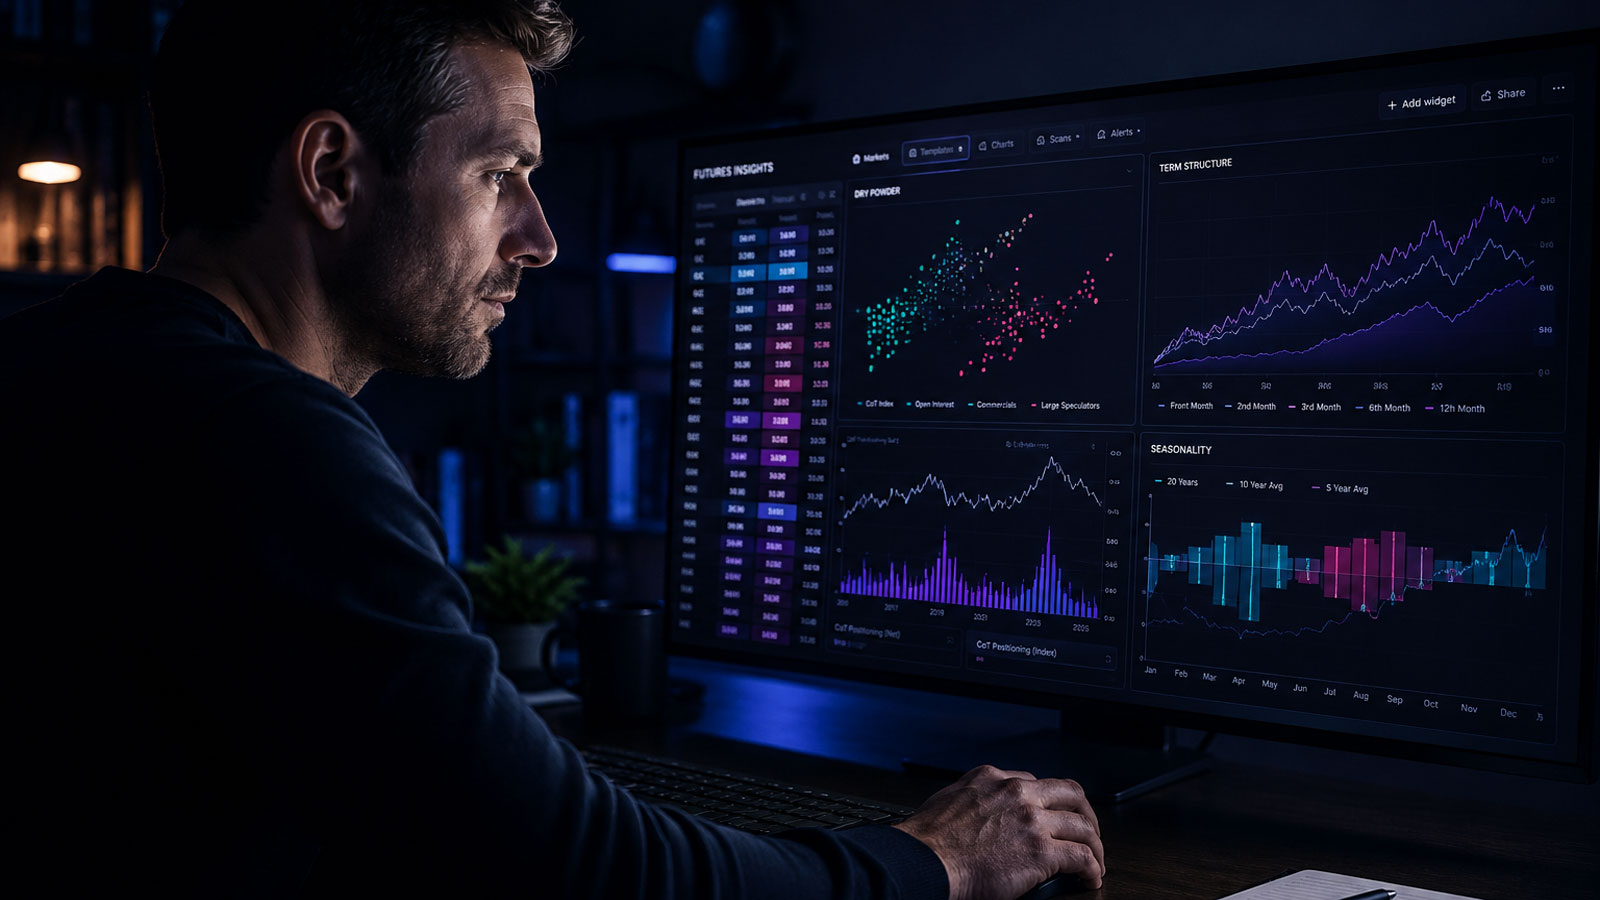
An editorial illustration of a trader reviewing market data; the screens are not a live Futures Insights view.Image: TradeNeon
Three data views. One market hypothesis.
What positioning, the futures curve and seasonality can tell you.
Most traders open a futures market and look at the same thing first: the chart. Price, candles, a moving average. That is technical analysis — and it is only half the picture. Fundamental analysis for futures asks a different question: what additional information might help explain this market beyond its price chart? For futures, those forces come down to three.
The short version
Technical analysis reads the chart. Fundamental analysis reads the forces behind it — for futures, that is positioning, supply and demand, and seasonality. Each one alone is a single dimension. Read together, they offer a structured view of a market. They do not determine the next price move.
In stocks, "fundamental" means balance sheets and earnings. Futures have none of that. Here, fundamental means the real forces of the market itself: who is positioned and how, whether physical supply is tight or abundant, and where the market sits in its seasonal cycle. The datasets can add context to the chart, though none identifies the cause of a price move on its own.
PositioningCoT data
Supply & demandterm structure
Cyclesseasonality
→
One readLong · Short · Neutral
The three forces, brought together into a single read per market — the idea behind Futures Insights.
Where the numbers come from
None of this is opinion data. Positioning comes from the CFTC’s public weekly Commitments of Traders report. It generally records Tuesday positions and is released on Friday, so it is not a live positioning feed. The contract curve compares traded futures maturities; seasonality studies historical prices. The work is reading these different datasets together, with their limits in view.
01
Positioning — the Commitment of Traders data
The CFTC publishes a weekly breakdown of reportable positions in covered futures markets. It shows aggregate positions by trader category, not the identity, intention or next trade of any participant. A positioning extreme deserves investigation; it does not establish when, or whether, a market will turn. CFTC explanatory notes describe what the reports include.
The report splits positions into categories, and the split is the point. In the legacy report, commercial and non-commercial are reporting classifications, not labels for "informed" and "uninformed" traders. The disaggregated report separates producers, swap dealers, managed money and other reportables in physical commodity markets. Non-reportable positions are grouped separately; they cannot simply be equated with retail traders. The headline net number hides these distinctions, so read each category in context. CFTC category definitions.
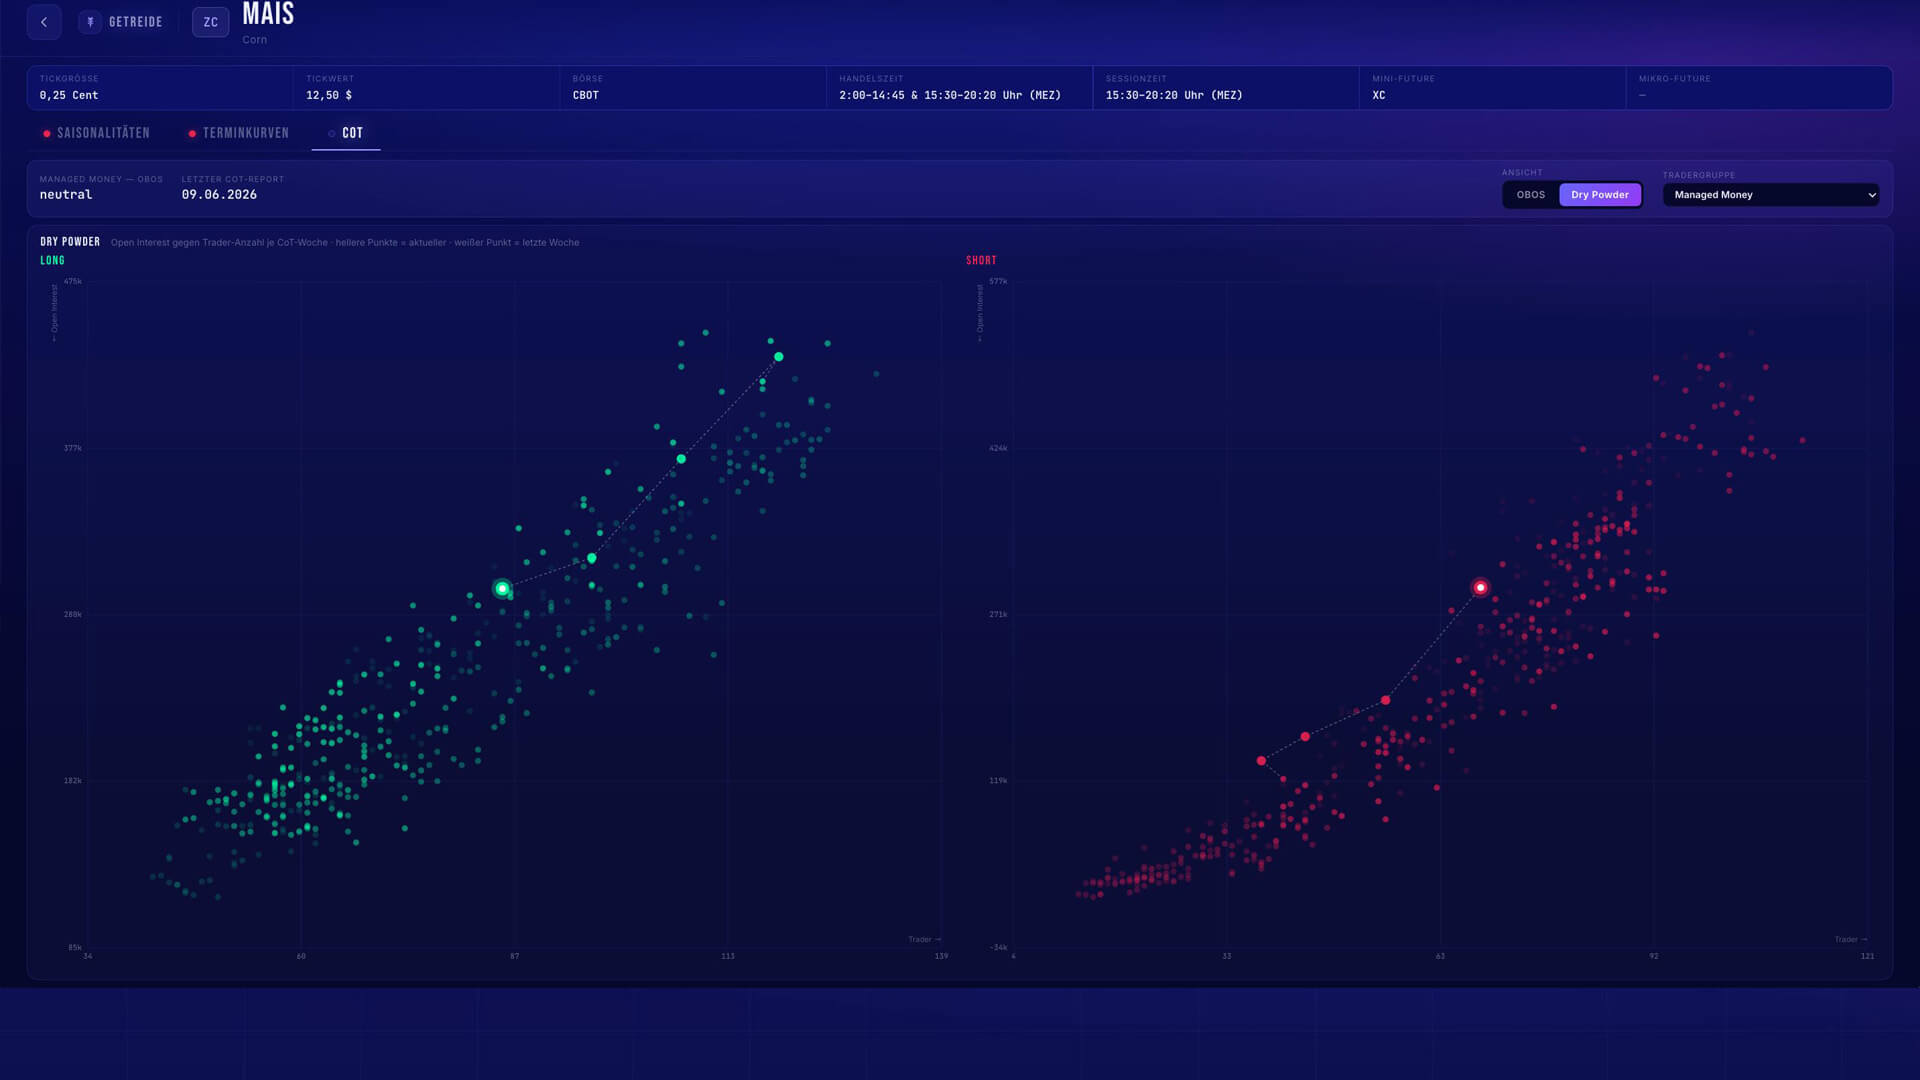
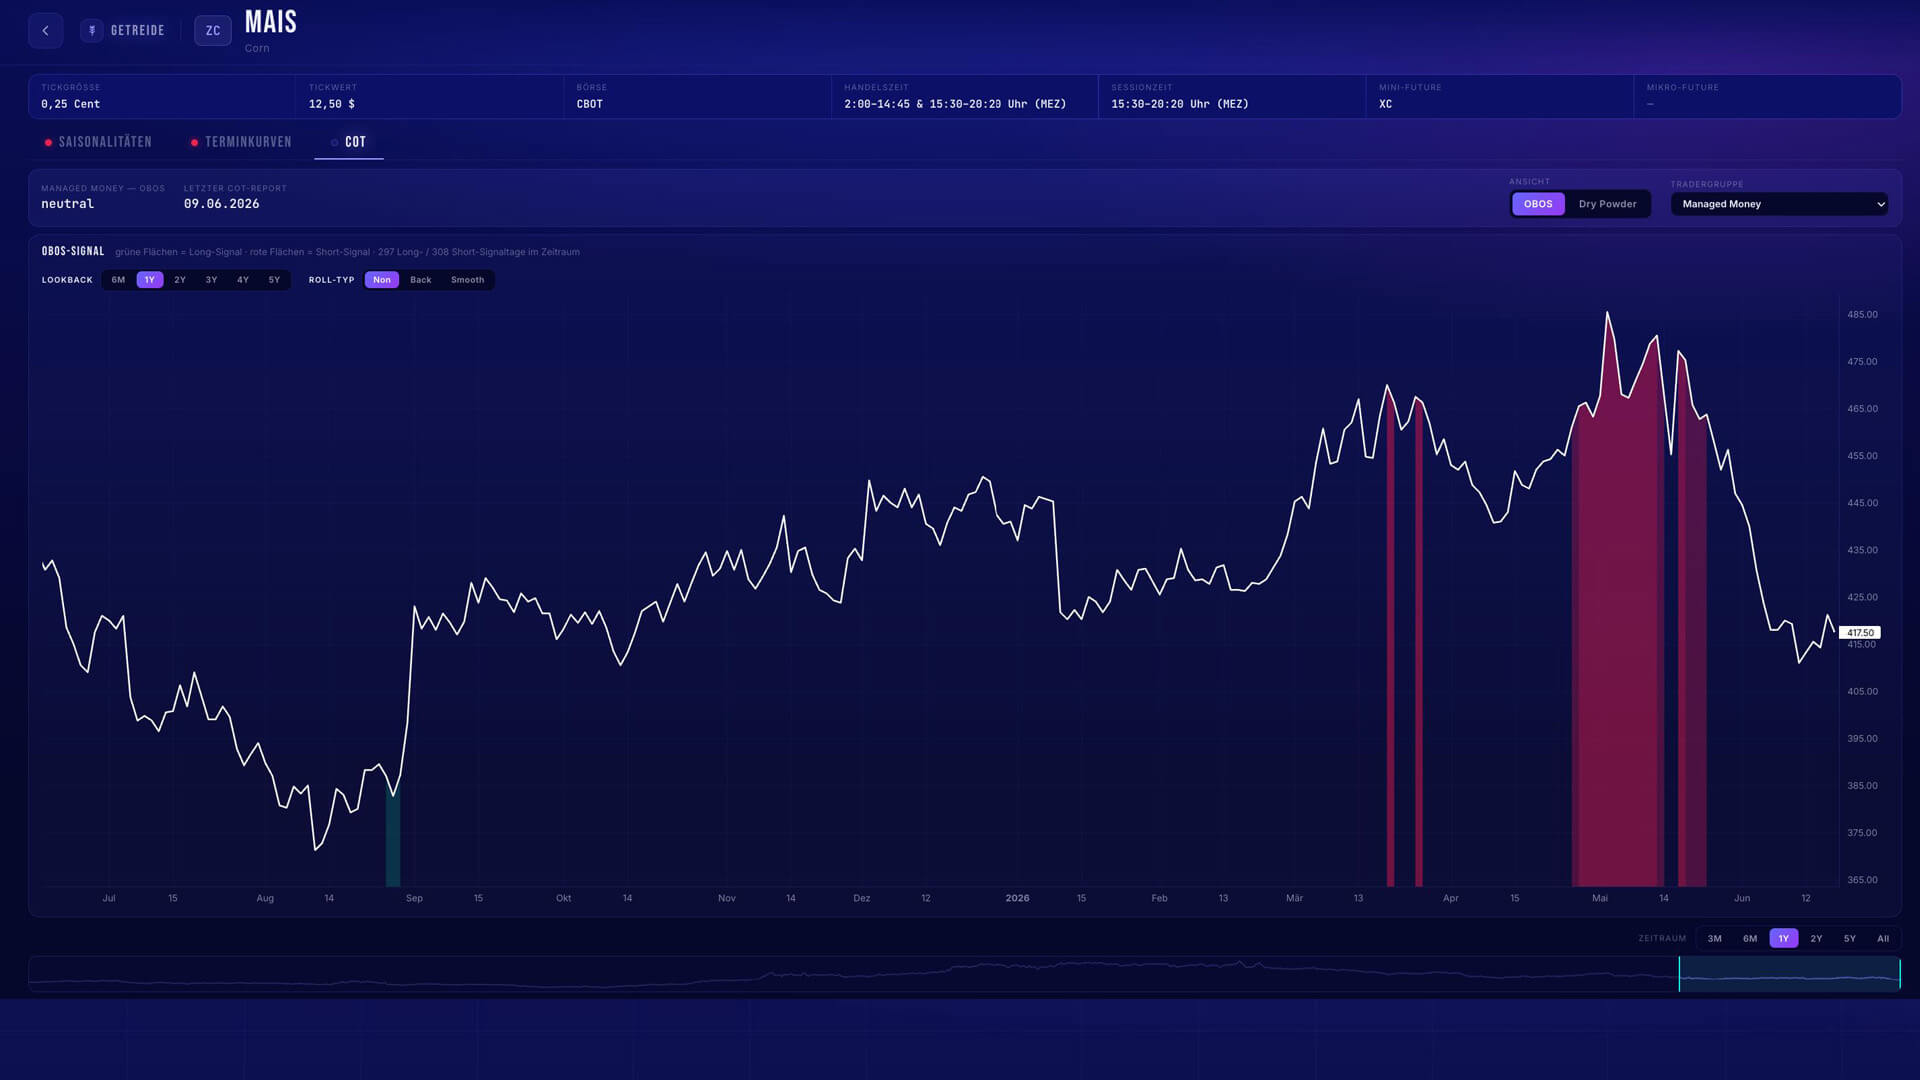
The raw report is dense, and the value is not in the headline net number — it is in reading positioning in context, against the open interest and against the extremes of previous years. Futures Insights does exactly that, and turns the CoT data into two reads:
Dry Powder — how much "unused powder" is ready at the market, built from open interest and the number of traders. It is a measure of fuel for the next move — not the absolute size of anyone's position.
OBOS — overbought / oversold. It sets current positioning against open interest and prior-year extremes, normalised into a clear over- or under-bought reading.
Dry Powder in Futures Insights — an indicator calculated from open interest and trader counts in CoT data. Example: Corn (ZC).OBOS in Futures Insights — current positioning against open interest and prior-year extremes, as one overbought/oversold reading. Example: Corn (ZC).
Common mistake: reading "commercials are short" as automatically bearish. Positioning is context, not a trigger — an extreme tells you the market is stretched, not that it turns tomorrow. Read our detailed CoT guide.
02
Supply and demand — the term structure
A futures market has contracts with different delivery months. When nearby contracts trade above later ones, the curve is backwardated; when later contracts trade above nearby ones, it is in contango. Its shape can reflect supply and demand, storage, financing and other carry factors. It is useful context, not a one-to-one measure of physical inventory. CME Group explains both curve shapes.
Backwardation
Front month higher. Later contracts cheaper; one possible sign of near-term tightness.
Contango
Front month lower. Later contracts dearer; carry costs can contribute.
M1 is the front (nearest) contract, M5 the furthest. The slope can add context to supply and carry conditions; it does not forecast price.
Futures Insights evaluates the curve using a Z-score — how unusual its current reading is relative to its own history — and Z-momentum, which shows how that reading is changing. These indicators can flag a change in the curve; they cannot establish that the outright futures price will turn or that a trade has an edge.
The curve is formed by market participants trading different delivery months. For physically delivered commodities, storage, insurance, financing and the value of immediate availability can all matter; their relative importance differs by market. In Gold, for example, financing and location can affect spreads. Treat a curve change as evidence to examine alongside other data, not as proof of a coming price reversal. CME on carry and convenience yield.
Term structure in Futures Insights — roll yield as a Z-score (how extreme) and Z-momentum (which way it turns). Example: Gold (GC).
Common mistake: reading contango as "bearish price". The curve can reflect supply and carry conditions, but it is not a price forecast — a market in contango can still rise.
03
Cycles — seasonality
Many futures markets follow recurring real-world rhythms: harvests, heating season, refinery turnarounds. Seasonality asks whether the calendar is currently a tailwind or a headwind. Futures Insights weighs many years of price history into a weighted seasonal score — and, just as important, shows consensus bands: how much the individual years actually agree on the current phase.
That agreement is the whole game. A seasonal average drawn over twenty years can look like a clean tailwind even when half of those years actually fell — the line is just the mean of a disagreement. Futures Insights treats a season as active only when enough years line up the same way, and it shows you that spread directly. An agreed historical pattern can carry more weight in the tool; a noisy one can be set aside. Neither is a forecast.
Seasonality in Futures Insights — a weighted score plus consensus bands. Agreement across past years describes historical consistency, not future reliability. Example: Gold (GC).
Common mistake: trading a seasonal average blindly. An average over disagreeing years is noise — historical agreement matters more than an average curve alone.
04
What a single CoT chart can't do
A classic CoT index scales commercial positioning across a chosen historical lookback, often as a 0–100 oscillator. Formulas and lookback windows vary. It shows one aspect of positioning, rather than the term structure or seasonal history. The underlying CFTC report supplies positions, not a ready-made CoT-index score.
Illustrative CoT index · 0–100 scaleExample
Schematic oscillator, not a live Gold reading. Futures Insights adds other data views to CoT positioning.
Futures Insights keeps that positioning read — and adds the dimensions a single chart leaves out: OBOS and Dry Powder from the same CoT data, plus term structure and seasonality. The result is a finished sentiment read per market, across 26 markets on one dashboard. The value is breadth and a consistent analysis workflow, not a trade signal. Whether it helps a trading strategy requires testing; Futures Insights cannot promise an outcome.
05
Why one number is never enough
Each force alone is a single dimension — and one dimension is easy to over-trust. A positioning extreme deserves a closer look if the curve and seasonal record point the other way. Agreement can make a hypothesis more coherent, but it does not prove an edge; disagreement may be a reason to wait or investigate further. Doing that by hand across dozens of markets every week is the work that stops most traders from using fundamentals at all. That is the job we built Futures Insights to do.
What the three forces show
How to read it
All three agree
All three agree. A coherent hypothesis to investigate on the chart; no automatic entry.
Two of three agree
Mixed evidence. Check the disagreement and your own trading rules.
The forces conflict
No clear combined view. Waiting may be appropriate.
The read is in the agreement, not in any single force — a way to think, not a trade instruction. You keep the decision.
06
What fundamental analysis for futures is not
It helps to be clear about the boundaries, because "fundamental" gets stretched in a lot of directions:
Not a signal service. A fundamental read tells you whether a market deserves attention and on which side — it never tells you to buy at a price with a stop and a target. You keep the decision.
Not a crystal ball. It can help form a market hypothesis; it does not establish a profitable edge or predict the next candle. An extreme can stay extreme.
Not stock fundamentals. No earnings, no balance sheets. For futures it is positioning, physical supply, and cycles — the real forces of the contract itself.
07
Reading one market: a worked example
Take Gold as a hypothetical illustration, not a current market reading. Suppose positioning is near a multi-year extreme, the contract curve turns backwardated and historical seasonality points in the same direction. The agreement gives you a hypothesis to investigate on the chart. It does not prove physical scarcity in Gold or establish that a long trade will work. CME explains why carry factors also shape the curve.
Now flip one force — say the season turns to a headwind. The picture gets murkier, and that is useful: you can examine the disagreement or wait for more evidence. Fundamentals do not remove your judgement, and agreement does not guarantee a favourable trade.
08
Fundamental vs. technical — not either/or
These two are often framed as rivals. They are not — they answer different questions. Fundamental data can help you decide which markets deserve attention and shape a directional hypothesis. Chart analysis can help with timing, entry and risk. Used together, they give different kinds of evidence; neither replaces your strategy or risk rules.
Frequently asked
Is Futures Insights a signal service?
No. It reads the fundamental forces and shows a context read — long, short, or neutral — per market. It never tells you to buy or sell at a price. The decision stays with you.
Do I have to read the CoT report myself?
No. Futures Insights uses weekly CFTC positioning data to calculate Dry Powder and OBOS across its markets. The underlying report is published after the Tuesday snapshot, generally on Friday. CFTC release schedule.
Which markets does it cover?
26 futures markets across eight sectors — metals, energy, grains, softs, meats, currencies, an equity index (ES) and volatility (VIX).
Does fundamental analysis replace technical analysis?
No. Fundamentals tell you whether and which side; technicals tell you when and where. They work best together.
Can I try it for free?
Yes. The Gold market is free on the Free Plan — no credit card required.
Oliver Sparing
Founder & Head of Trading · TradeNeon
Oliver Sparing has been actively trading the financial markets since 2011. His professional roots lie in precious metals trading in Hamburg; in 2017 he learned at a London trading floor. At TradeNeon he leads the day trading and swing trading programmes and is responsible for the trading methodology, with a focus on order flow, market structure and fundamental market data. Level of Interest, Futures Insights and Lab of Trades grew out of this work. Platforms such as ATAS, Bookmap and WH SelfInvest regularly invite him as a guest. All guest appearances
Level of Interest: The market analysis behind the levels
Oliver Sparing
Founder & Head of Trading · TradeNeon
Webinar in German, June 19, 2025 · 62 min video
Every morning, the levels are drawn onto the chart by hand and cross-checked against the order book. The software Level of Interest grew out of that routine and brings these levels into your own charting software. This article tells how it came about, which seven data areas feed into the analysis and how the levels can be used in trading.
The same session, once without and once with the levels that are set before trading begins.Chart: TradeNeon
Many perspectives. One chart.
The levels are built each morning from several data sources. How the market responds, the order book shows.
Level of Interest draws levels onto the chart that are derived by hand every morning from seven data areas, including dealer hedging, dark pool data, volume and market profile, VWAPs and the CME's SPAN data. The levels are cross-checked against the order book and are not changed during the day. They show where it is worth looking closely but a reaction is never certain.
Oliver has traded for many years, first swing trading and commodities, later day trading as well. On a trading floor in London, he learned that a market analysis is part of every professional trading session's preparation. It can be very multilayered, and there is no single way to do it. His own analysis has developed considerably over the years: today he draws on a large number of data sources, evaluates them every morning and uses them to build a plan for the entire trading day.
The training programme raised the question of how participants can check their own analysis. So a screenshot of the levels was posted on the Discord server every morning. Participants drew in their own levels and compared them with these. At some point, people asked to see the levels in their own charting software. That was the start of Level of Interest. Together with the development team, a very basic version was built first. Later, TradeNeon decided to offer the levels to traders outside the training programme as well and to build the tool on a more professional footing.
03
Levels set in the morning, unchanged all day
Transparency was the goal from the start. The analysis was posted as a screenshot, and the next morning a second one followed with the full price action of the day. That way, anyone can judge for themselves whether price reacted to the levels or not.
A firm rule goes with this: the levels drawn in the morning are “set in stone.” They are not changed during the day, and the same applies to Level of Interest as software.
04
The seven areas of the analysis
Seven areas feed into the analysis.
Dealer hedging This calculates where dealer hedgingOption dealers hedge the risk from options trading by buying and selling in the underlying market, which influences price. is especially strong and in which areas market makers mainly have to buy or mainly have to sell. This is where the bullish and bearish hedging levels come from.
Fibonacci retracements Classic Fibonacci retracementsA chart analysis tool that derives price levels from a previous price move. give levels that price can still react to in 2025. They are drawn by hand, cross-checked against current order book data and only set if they are relevant at that moment.
Dark pool data Large orders in the dark poolA private exchange where large orders are traded away from the official exchange. Trades are reported afterwards. are reported at the end of the day. They show at which price levels and in what size large positions were traded, but not who traded or whether it was long or short.
Volume and market profile The volume profileShows how much was traded at which price levels. and the market profile show where fair price areas were and where price moved quickly. Combined with the order book, they mark areas where institutional participants have built large positions.
Liquidity in the order book The limit orders in the order book are the foundation: every level should be confirmed by liquidity clusters. Historical extremes are added to this.
VWAPs The VWAPVolume Weighted Average Price: the volume-weighted average price over a period. shows the average price paid in the market over a period of time and is a reference point for who controls the trend. In addition, the VWAPs of the previous day, week and month are drawn when they sit in a relevant price area.
The CME's SPAN data The CME's SPANThe CME's risk assessment method, from which the recommended initial margin for futures is derived. method provides the daily risk assessment. From it, TradeNeon calculates a price range starting from the previous day's close, with strong reactions often to be expected at its edge.
The aim is to look at the market from as many perspectives as possible and to build a comprehensive picture of where institutional interest sits on the chart. When several factors coincide, such as a strong dealer hedging level lining up with a dark pool level, several data sources point to the same spot. You can find tutorials on all seven areas in the Level of Interest tutorials.
05
Dealer hedging: bullish and bearish levels
Whoever buys or sells an option usually has a market makerA market participant that provides liquidity to the market and takes the other side of trades in return. on the other side of the trade, a so-called option dealer. The dealer's job is to provide liquidity to the market so that you get filled quickly, at your price and without a wide spread. The business model is not to speculate against you: the dealer tries to pass the trade on to the other side of the order book right away at a small profit. If that fails, a directional risk remains, which the dealer neutralizes by buying or selling the underlying. In doing so, the dealer moves the price. This hedging is dynamic: it depends on price direction, volatility and time, and has to be adjusted continuously.
Level of Interest calculates where this hedging is particularly strong and in which areas market makers mainly have to buy or mainly have to sell. These are the green and red levels as well as the large green and red zones at the edge of the chart. TradeNeon does not take data over statically but interprets it and does its own calculations.
Besides gammaOne of the so-called Greeks in options trading that influence the hedging activity of market makers., TradeNeon includes vannaOne of the so-called Greeks in options trading that influence the hedging activity of market makers. and charmOne of the so-called Greeks in options trading that influence the hedging activity of market makers.. That is why TradeNeon calls them bullish and bearish hedging levels, not gamma, vanna or charm levels. The assumption behind this: when the market reaches such a level, market makers have to lean towards buying or towards selling. Price does not always have to rise from a bullish level, though. Hedging activity is only one part of the market, and other participants have their own agenda. “Of course we cannot promise that every bullish hedging level sends price shooting up and every bearish one sends it down,” says Oliver.
Converting between related markets calls for care. Carrying a level from the SPX or the SPY over to the ES at a fixed mathematical distance often does not work well, because the relationship is dynamic. That is why TradeNeon cross-checks the levels against order book data and against volume and market profile data.
06
Fibonacci, dark pool data and the order book
Fibonacci retracements
Almost every common charting platform has Fibonacci tools, and in 2025 price still reacts to certain levels. What matters is how they are used: “In my opinion, it is not necessarily useful to draw Fibonacci retracements at random in trending phases and go long or short at the 50 level. You have to know how to combine Fibonacci concepts with other data to arrive at the levels that really have some relevance,” says Oliver Sparing. TradeNeon draws all levels by hand and cross-checks them against current order book data. If a level has no relevance at the moment, it is not drawn. Ideally, that avoids a “jungle” of levels on the chart.
Dark pool data
Dark pools are private exchanges where traders with deep pockets can route orders past the official exchange. That sounds like a conspiracy theory, but it is more transparent than people think: in the US, traders have to disclose their positions traded in dark pools to the US regulator at the end of the day. You do not see who traded, or whether it was long or short, but you do see at which price levels and in what size large positions were traded. The background: large market participants want to bring their orders into the market gradually, without moving the price against themselves. TradeNeon also cross-checks this data against the order book and provides it as dark pool levels.
Volume and market profile, liquidity
Volume and market profile are part of a day trader's standard toolkit today. They show where fair price areas were, where price moved quickly and where the premium and discount areas of an auction were. TradeNeon combines this data with the order book to mark areas where institutional participants have built large positions and that will probably be defended if the market comes back. Large round prices come on top, as they are important levels by nature.
Liquidity, meaning the limit orders in the order book, is the foundation: every level should be confirmed by liquidity clusters. Not every limit order is relevant, though. That is why the order book is always included, to see exactly where institutional interest lies.
07
VWAPs and the SPAN interval
The VWAP shows the average price paid in the market over a period of time. An example: if a fund manager wants to build a larger position over several days in an uptrend, the moment the market comes back to the trend's VWAP is the most favorable time to buy, before the average long position slips into a loss. That is why VWAPs are reference points for who controls the trend, and they can be strong resistance and support zones. In addition, TradeNeon draws the VWAP of the previous day, the previous week and the previous month when they sit in a relevant price area. If price is above the previous day's closing VWAP, the average long position from that day is in profit. That is important information but not the holy grail. Many partial aspects count toward the day's biasThe basic direction with which you enter the trading day..
The CME, the largest futures exchange in the world, provides the SPAN data every day. The SPAN framework is used to simulate portfolio risk and contains the daily risk assessment from which the recommended initial margin is derived. On that basis, and starting from the previous day's close, TradeNeon calculates a price range showing how far price can run before institutional traders come under pressure and receive margin callsA demand to add funds or reduce positions when the collateral is too low..
The interval has two advantages. Institutional traders have an interest in keeping price within this interval, so strong reactions are often to be expected at its edge. If the market breaks out of the interval, however, participants have to adjust, buy more or reduce positions, and volatility can rise rapidly. For beginners, this means: “If you are a day trading beginner, concentrate on trades inside the SPAN interval at first, because the market behaves more rationally there and reacts better to our levels,” says Oliver. The analysis itself is accordingly not drawn far beyond the interval.
08
Questions from the chat: levels during the day
On the settlement price: it is the settlement price of the previous day as set by the exchange, the market often reacts to it, and it plays into the day's bias. As a rule of thumb, the tendency is more bullish above the settlement price and more bearish below it.
On whether a level that price has already run into should be ignored from then on: “yes and no.” If the market rotates around a level and no longer respects it, you should not take trades there for the time being. If the market moves further away from the level and comes back later, experience shows that a reaction is to be expected again, even though that is a discretionary assessment. “There are moments when I say: the market obviously has no interest in this level anymore, so I keep my hands off. But the same level can offer a really good entry opportunity at a later point,” says Oliver.
On the pre-session: the levels are calculated mainly from what happened in the cash sessions, because that is where most of the trading takes place. In his experience, they work just as well in the pre-session. On the exchange holiday that the webinar fell on, there were no levels, because no institutional trading took place.
09
Interpretation instead of raw data
Level of Interest is not a pure data provider. The slogan is “See what matters”: TradeNeon draws on many data sources, evaluates them and draws the result onto the chart. Every morning, a manually produced market analysis is created that rests on many years of experience. It is based on data, but further factors feed in as well, to place each level as precisely as possible where it belongs.
Oliver himself is a discretionary order book trader and uses the levels for that. Level of Interest, however, can be combined with any existing system, and very different approaches can be developed on the basis of the levels. One approach for developing a system based on the levels was presented in the ATAS webinar on backtesting.
Raw data alone decides little: what matters is what the trader makes of it. With Level of Interest, the point is therefore to draw onto the chart what has practical value.
10
Level of Interest in ATAS
Level of Interest is a plugin for ATAS, in other words an indicator. You place it in your indicator folder as usual and load it in any chart. You enter the license key in the indicator settings and then have access to the levels of the markets you have subscribed to. The labels of the levels can be switched on and off in the indicator settings. The software also runs on other platforms; you can find the overview on the Level of Interest page.
11
What you can take away from the webinar
Market analysis is the foundation of preparation. Every session starts with a plan derived from many data sources. The levels are drawn before the open.
Several perspectives give a fuller picture. Areas where different data sources meet deserve particular attention, such as a hedging level with a dark pool level.
A level is a place, not a certainty. A reaction is never certain. The order book belongs with every level because it shows precisely where institutional interest lies.
Traceability builds trust. Levels that are fixed in the morning and not changed during the day can be compared with price action by you, every day.
“Data is only ever as meaningful and as powerful as the trader who uses, evaluates and interprets it.”
Oliver Sparing in the ATAS webinar (translated from German)
12
About the webinar
The webinar ran on June 19, 2025 as part of the webinar series on the YouTube channel of ATAS Deutschland. In this series, ATAS presents external developments and tools that work with the platform. It is held in German; on YouTube, you can switch on automatically translated subtitles. ATAS is a trading platform for order flow analysis. Oliver is a regular guest there; you can find all appearances on our guest appearances page.
Level of Interest
Which levels deserve a closer look?
Level of Interest helps you find potential price areas for analysis. You assess how the market trades when it reaches them.
Level of Interest is software from TradeNeon that draws levels onto the chart. The levels are derived by hand every morning from seven data areas, including dealer hedging, dark pool data, volume and market profile, VWAPs and the CME's SPAN data, and cross-checked against the order book.
Are the levels adjusted during the day?
No. The levels drawn in the morning are “set in stone” and are not changed during the day. That way, you can check every day whether price reacted to them.
Should I ignore a level if price has already run into it?
Not across the board. If the market rotates around a level and no longer respects it, you should not take trades there for the time being. If the market has moved further away and comes back later, experience shows that a reaction is to be expected again, even though that is a discretionary assessment.
Do I have to trade Level of Interest with a specific system?
No. The levels can be combined with any existing system, and very different approaches can be developed on their basis. They originally came about for discretionary order book trading.
Level of InterestMarket AnalysisATAS
Oliver Sparing
Founder & Head of Trading · TradeNeon
Oliver Sparing has been actively trading the financial markets since 2011. His professional roots lie in precious metals trading in Hamburg; in 2017 he learned at a London trading floor. At TradeNeon he leads the day trading and swing trading programmes and is responsible for the trading methodology, with a focus on order flow, market structure and fundamental market data. Level of Interest, Futures Insights and Lab of Trades grew out of this work. Platforms such as ATAS, Bookmap and WH SelfInvest regularly invite him as a guest. All guest appearances
TradeNeon is a web-based fundamental analysis software. Find ideal trading opportunities to execute trades with confidence and high success rates! It has never been easier!


 A rules-based strategy specifies the conditions under which trades are placed. These include the stock universe, entry and exit criteria, and position-sizing rules. The stock universe determines which stocks can be considered for a trade.