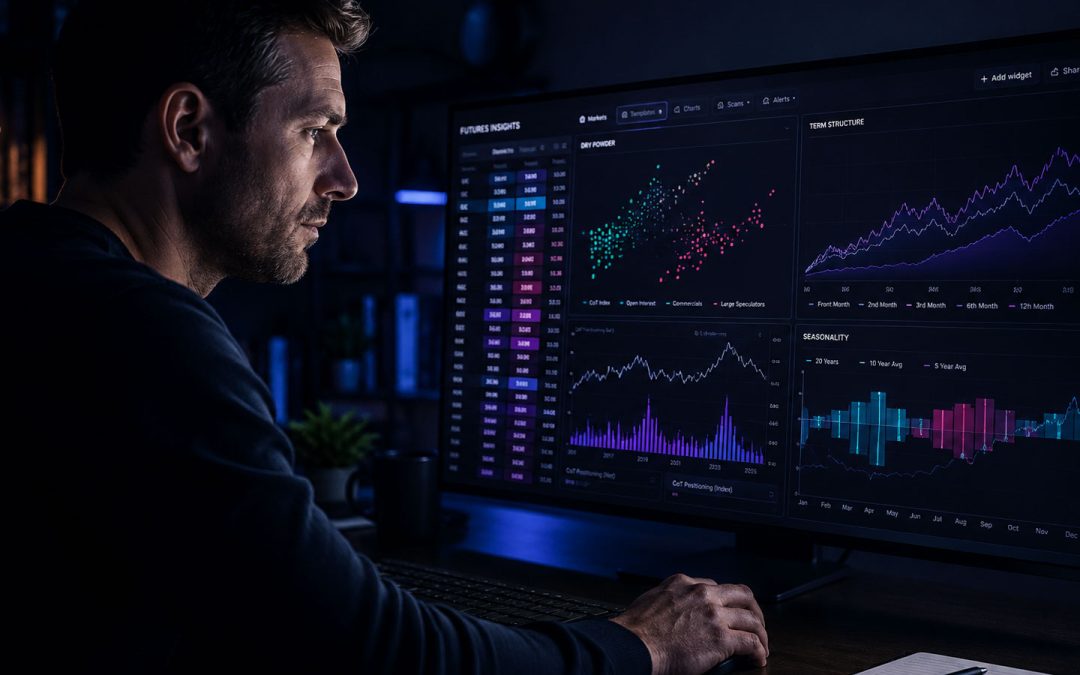

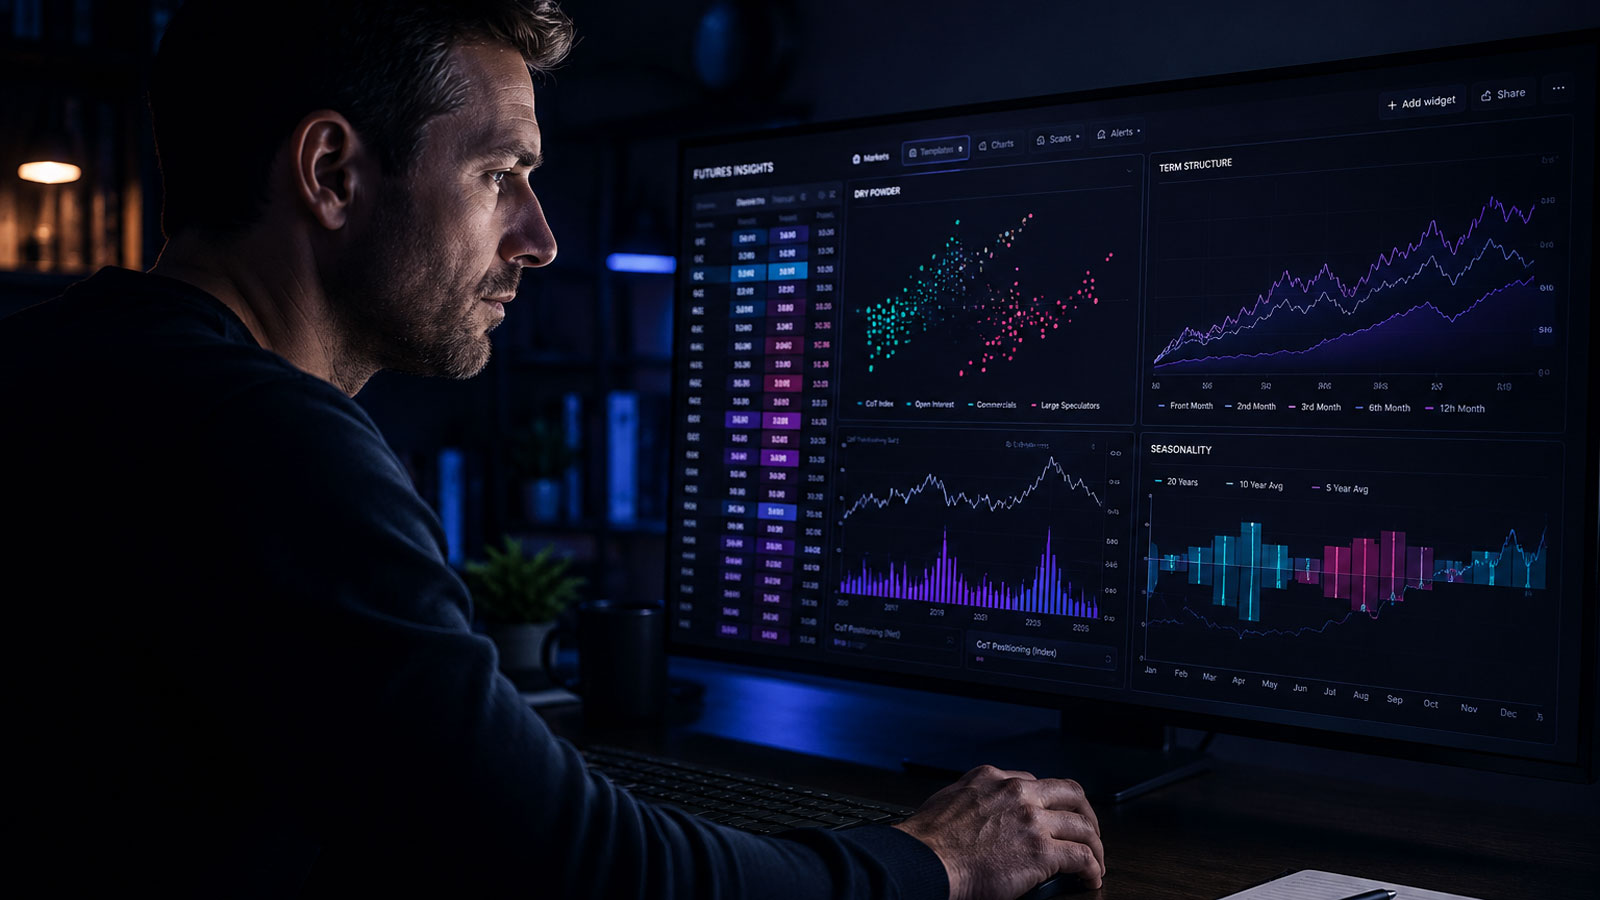
Most traders open a futures market and look at the same thing first: the chart. Price, candles, a moving average. That is technical analysis — and it is only half the picture. Fundamental analysis for futures asks a different question: what real-world forces are acting on this market right now, before they reach the price? For futures, those forces come down to three.
Technical analysis reads the chart. Fundamental analysis reads the forces behind it — for futures, that is positioning, supply and demand, and seasonality. Each one alone is a single dimension. Read together, they become a clear read on a market: long, short, or neutral.
In stocks, "fundamental" means balance sheets and earnings. Futures have none of that. Here, fundamental means the real forces of the market itself: who is positioned and how, whether physical supply is tight or abundant, and where the market sits in its seasonal cycle. None of that lives on the chart — but all of it moves the chart.
None of this is opinion data. Positioning comes from the CFTC’s weekly Commitment of Traders report — free, public, the same numbers the desks read. Supply tension comes from the live contract curve. Seasonality comes from decades of price history. The work is not getting the data; it is turning three different datasets into one read, every week, across every market.
Positioning — the Commitment of Traders data
Every week, the U.S. regulator (the CFTC) publishes the Commitment of Traders report: who holds what in each major futures market. The most-watched group is the commercials — the producers and hedgers with real physical exposure to the underlying. They are the closest thing the market has to informed money. When their positioning reaches an extreme, a turn often follows.
The report splits the market into groups, and the split is the point. Commercials — the producers, miners and merchants who handle the physical good — hedge real exposure and are the closest thing to informed money. Large speculators are trend-following funds; small traders are the retail crowd. When the informed side reaches a positioning extreme, the classic read treats it as a warning — but the headline net number hides which group is doing what, so each one has to be read in context.
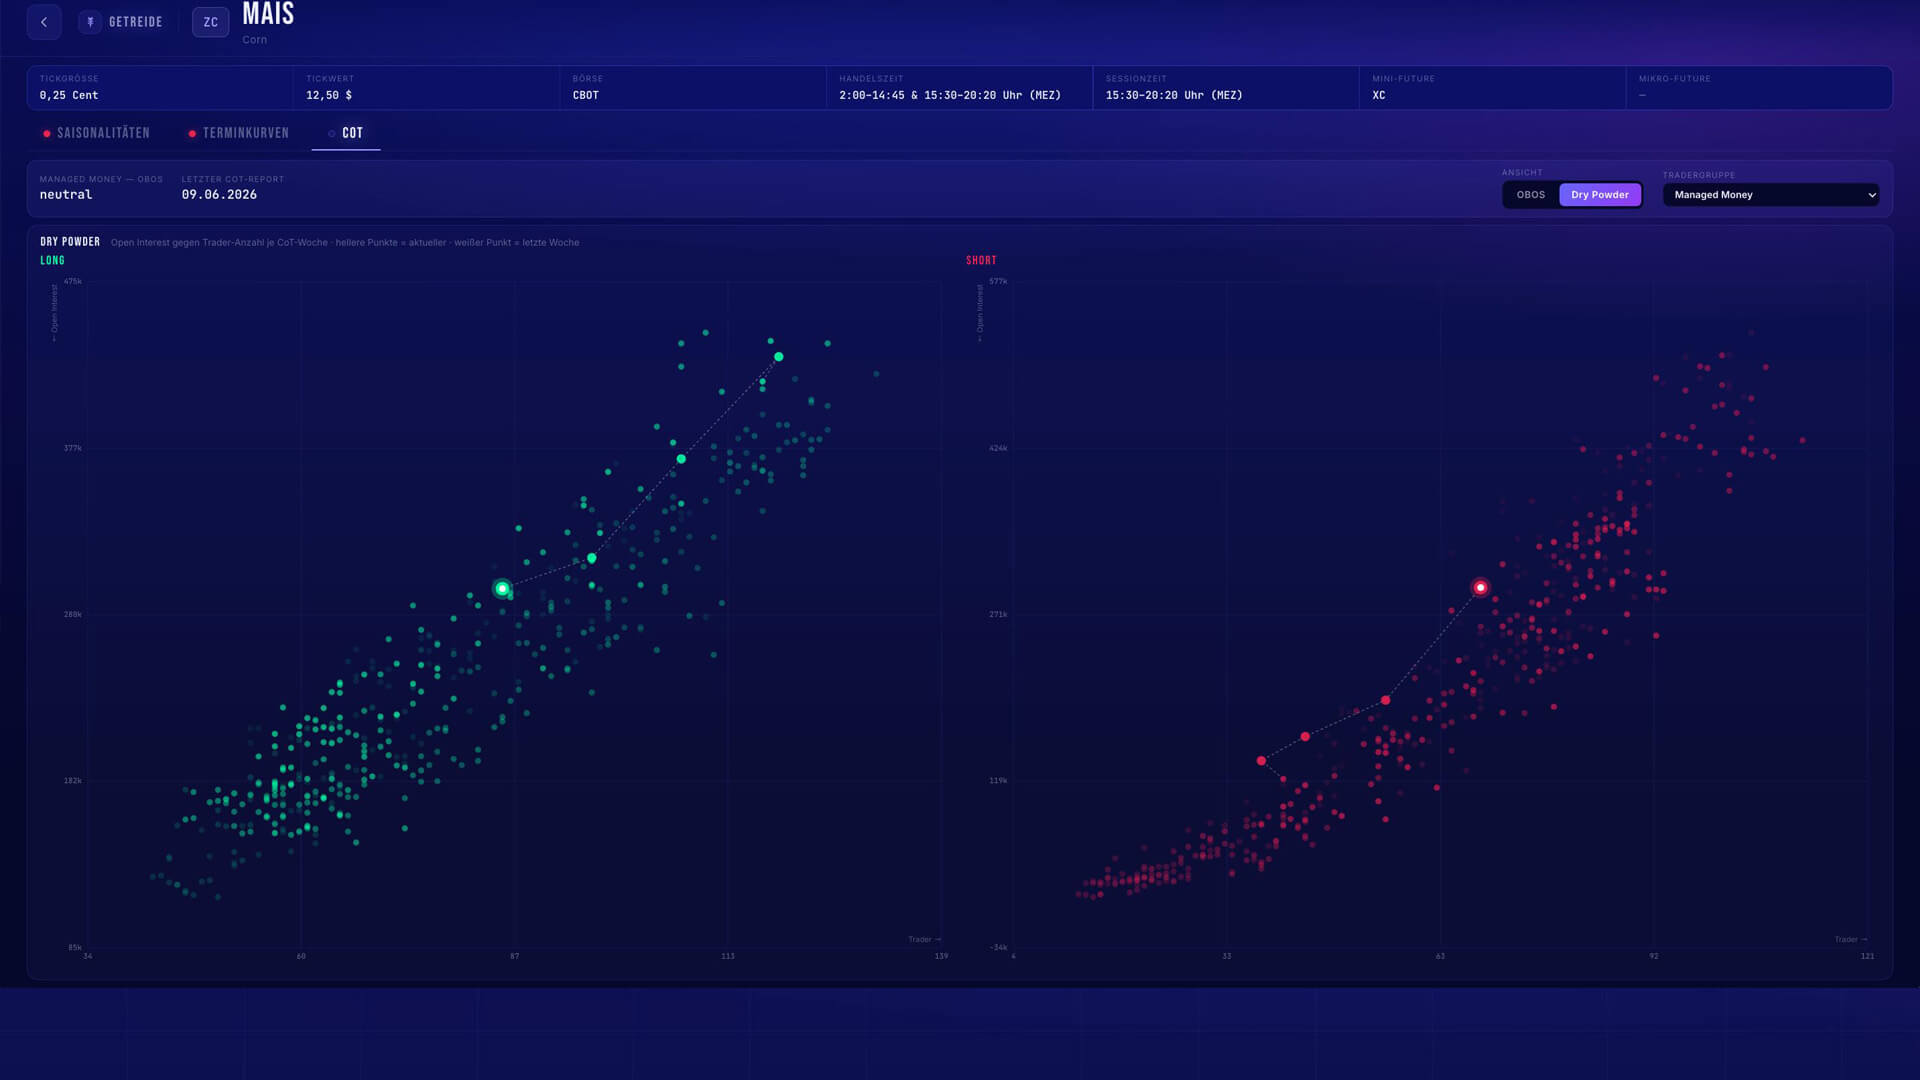
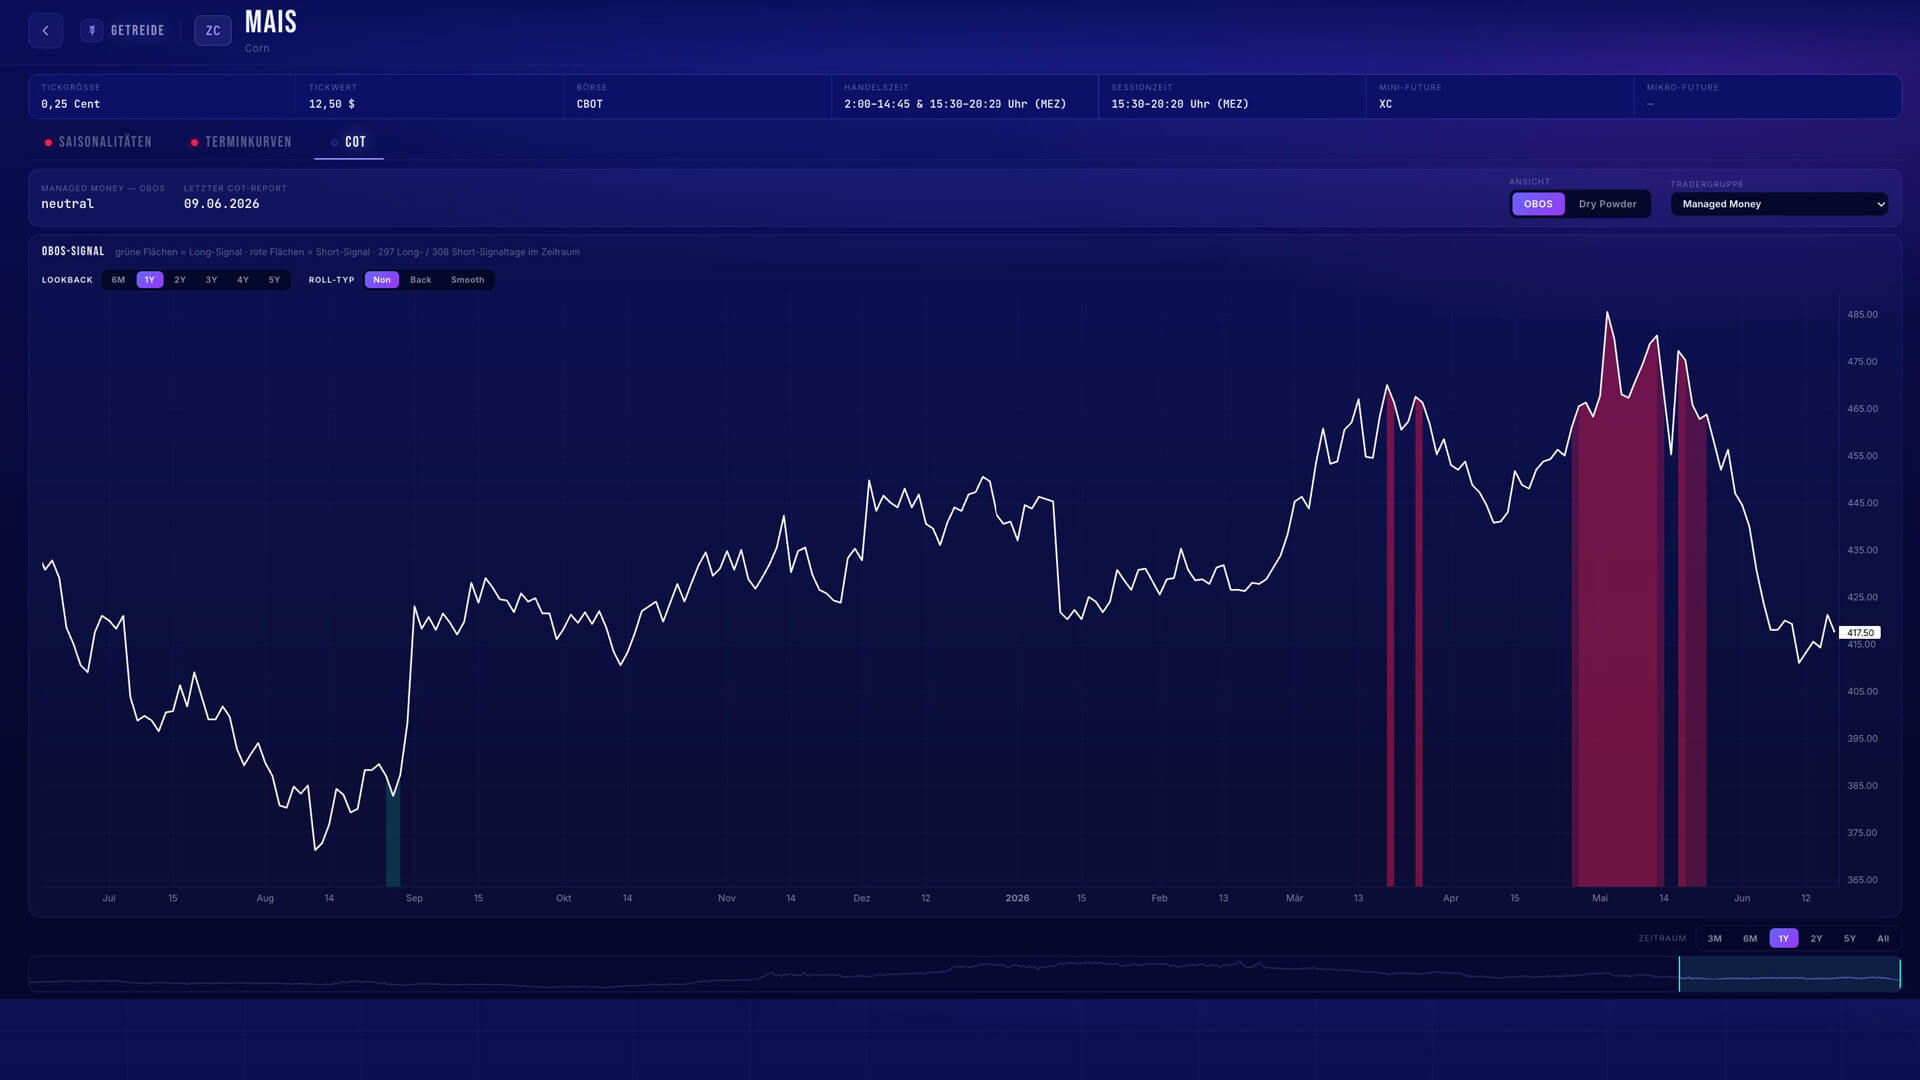
The raw report is dense, and the value is not in the headline net number — it is in reading positioning in context, against the open interest and against the extremes of previous years. Futures Insights does exactly that, and turns the CoT data into two reads:
- Dry Powder — how much "unused powder" is ready at the market, built from open interest and the number of traders. It is a measure of fuel for the next move — not the absolute size of anyone's position.
- OBOS — overbought / oversold. It sets current positioning against open interest and prior-year extremes, normalised into a clear over- or under-bought reading.
Common mistake: reading "commercials are short" as automatically bearish. Positioning is context, not a trigger — an extreme tells you the market is stretched, not that it turns tomorrow.
Supply and demand — the term structure
A futures market is not one price — it is a curve of contracts across time. Compare the front-month contract with the later ones and the shape of that curve tells you the supply situation. Front higher than later months — backwardation — signals scarcity. Front lower — contango — signals abundance.
Front month highest. Later contracts cheaper → physical supply is tight.
Front month lowest. Later contracts dearer → physical supply is ample.
Futures Insights measures the roll yield of that curve as a Z-score — how extreme the situation is right now — and a Z-momentum — which way the curve is turning. Tightness and turning points become visible before they reach the price. Few retail tools read this at all, which is exactly why it carries an edge.
What gives the curve its edge is who sets it. The shape is priced by the firms that store, finance and deliver the physical good — a steep backwardation means someone is paying up to hold the goods now, which is real scarcity rather than a forecast. Opinion can be wrong; a carry cost is paid in cash. That is why a turn in the curve so often arrives before the turn in the price.

Common mistake: reading contango as "bearish price". The curve is a supply read, not a price forecast — a market in contango can still rise.
Cycles — seasonality
Many futures markets follow recurring real-world rhythms: harvests, heating season, refinery turnarounds. Seasonality asks whether the calendar is currently a tailwind or a headwind. Futures Insights weighs many years of price history into a weighted seasonal score — and, just as important, shows consensus bands: how much the individual years actually agree on the current phase.
That agreement is the whole game. A seasonal average drawn over twenty years can look like a clean tailwind even when half of those years actually fell — the line is just the mean of a disagreement. Futures Insights treats a season as active only when enough years line up the same way, and it shows you that spread directly. A strong, agreed pattern earns weight; a noisy one is set aside.
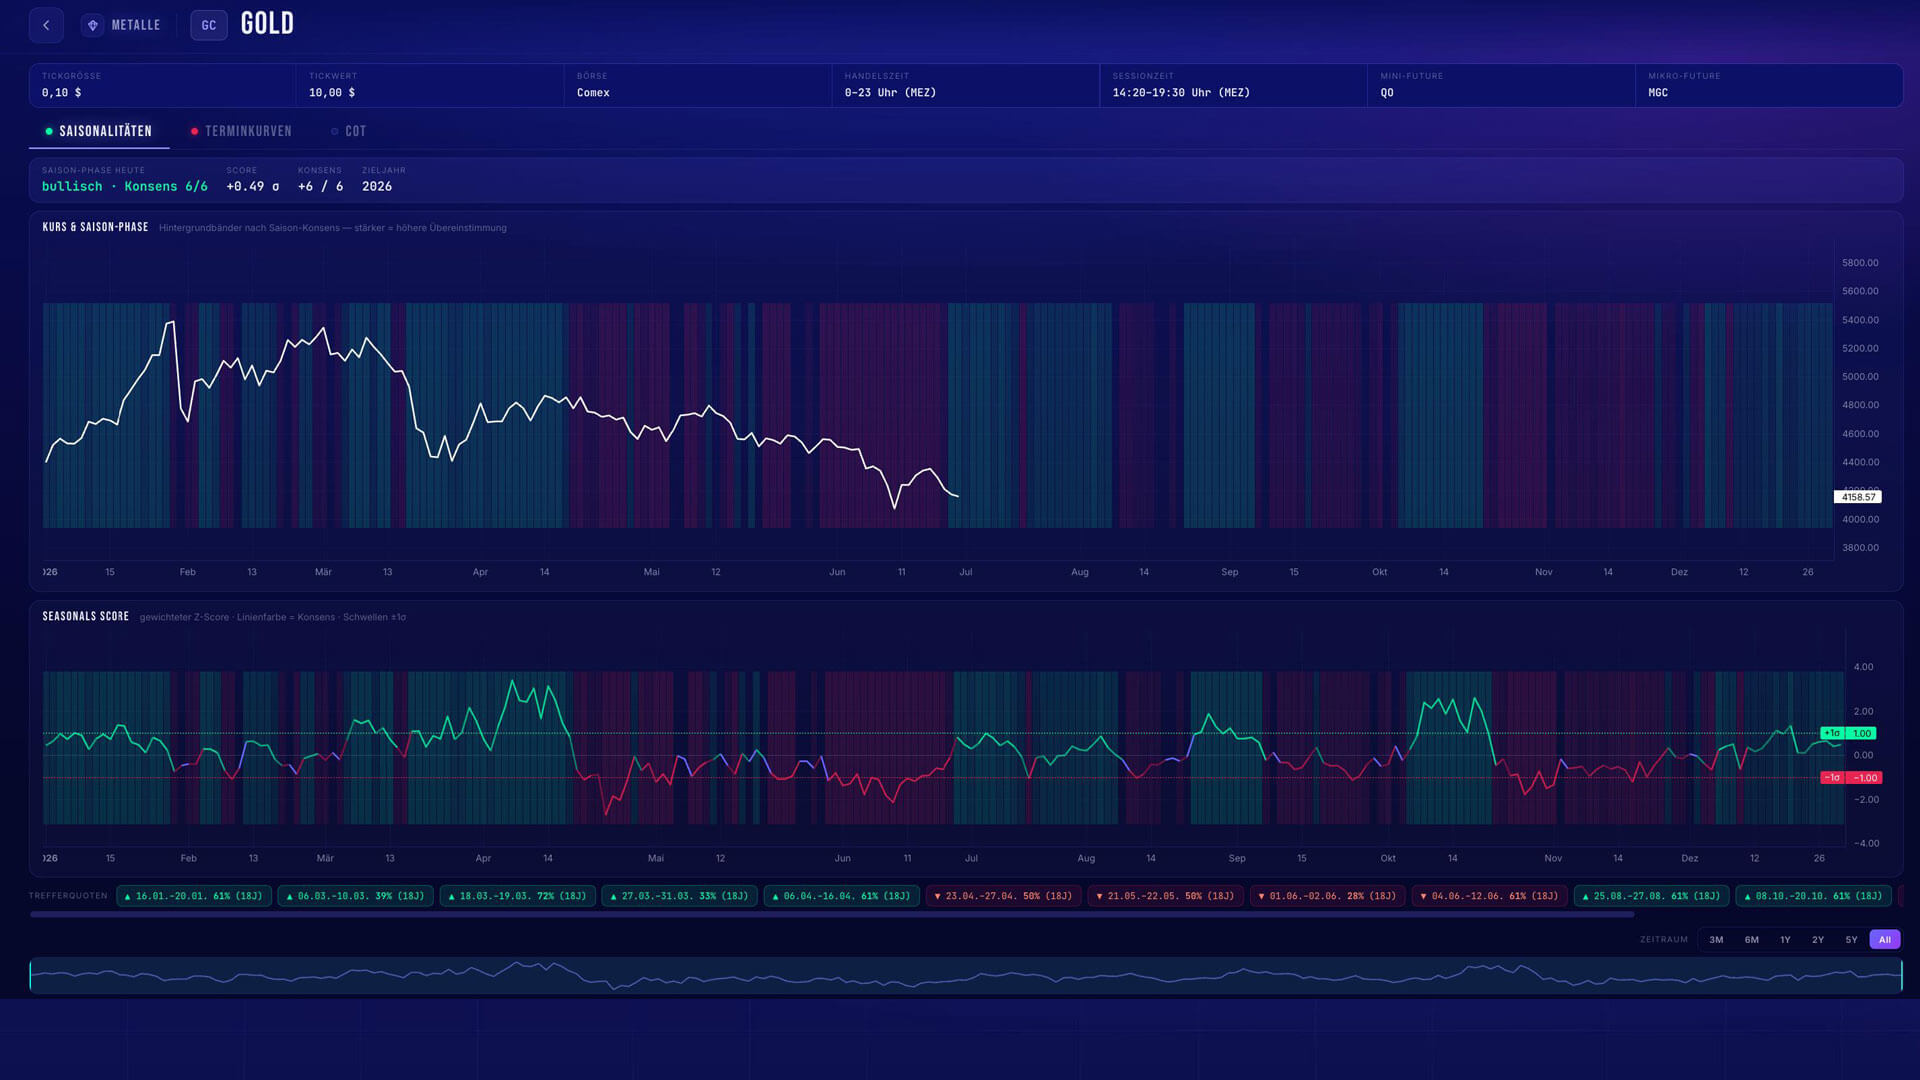
Common mistake: trading a seasonal average blindly. An average over disagreeing years is noise — the signal lives in the consensus, not the headline curve.
What a single CoT chart can't do
The classic Commitment-of-Traders index — the one Larry Williams popularised — is a single oscillator: commercial net position divided by open interest, normalised to a 0–100 range over the last 26 weeks. It is a good, established read. But it is one oscillator, one dimension, commercials only.
Futures Insights keeps that positioning read — and adds the dimensions a single chart leaves out: OBOS and Dry Powder from the same CoT data, plus term structure and seasonality. The result is a finished sentiment read per market, across 26 markets on one dashboard. The honest framing matters here: the edge is breadth and a finished read, not a magic signal. Whether any read makes money still depends on your strategy — Futures Insights does not promise to be "right", it promises to do the reading.
Why one number is never enough
Each force alone is a single dimension — and one dimension is easy to over-trust. A positioning extreme means little if the term structure and the season point the other way. The read is in the agreement: when independent forces line up, the case is stronger; when they conflict, the honest answer is "stay out". Doing that by hand across dozens of markets every week is the work that stops most traders from using fundamentals at all. That is the job we built Futures Insights to do.
| What the three forces show | How to read it |
|---|---|
| All three agree | Strong case. A market worth watching on that side — take it to the chart and look for an entry. |
| Two of three agree | Lean, don’t commit. A tilt worth noting — wait for the third force or the chart to confirm. |
| The forces conflict | Stay out. The disagreement is itself the signal — no fundamental wind at your back. |
What fundamental analysis for futures is not
It helps to be clear about the boundaries, because "fundamental" gets stretched in a lot of directions:
- Not a signal service. A fundamental read tells you whether a market deserves attention and on which side — it never tells you to buy at a price with a stop and a target. You keep the decision.
- Not a crystal ball. It shifts probability in your favour; it does not predict the next candle. An extreme can stay extreme.
- Not stock fundamentals. No earnings, no balance sheets. For futures it is positioning, physical supply, and cycles — the real forces of the contract itself.
Reading one market: a worked example
Take Gold as an illustration. Suppose the CoT positioning is sitting near a multi-year extreme, the term structure has tipped into backwardation — physical tightness — and the seasonal window is a mild tailwind. Three independent forces pointing the same way is a far stronger case than any one of them alone: this is a market worth watching on the long side, and a place to look for an entry on the chart.
Now flip one force — say the season turns to a headwind. The picture gets murkier, and that is the useful part: the disagreement is itself the signal to wait. Fundamentals do not remove your judgement — they tell you when the wind is at your back, and when it is not.
Fundamental vs. technical — not either/or
These two are often framed as rivals. They are not — they answer different questions. Fundamentals tell you whether a market deserves your attention, and on which side. Technicals tell you when and where to act. Used together, the fundamental read filters the markets down to the few that matter, and the chart times the entry. One without the other is half a decision.
Frequently asked
Is Futures Insights a signal service?
No. It reads the fundamental forces and shows a context read — long, short, or neutral — per market. It never tells you to buy or sell at a price. The decision stays with you.
Do I have to read the CoT report myself?
No. Futures Insights pulls the weekly CFTC data and turns it into Dry Powder and OBOS automatically, across markets. That manual weekend work is exactly what it removes.
Which markets does it cover?
26 futures markets across eight sectors — metals, energy, grains, softs, meats, currencies, an equity index (ES) and volatility (VIX).
Does fundamental analysis replace technical analysis?
No. Fundamentals tell you whether and which side; technicals tell you when and where. They work best together.
Can I try it for free?
Yes. The Gold market is free on the Free Plan — no credit card required.
