Learning day trading: which path is right?

Learning day trading: which path is right?

Trading Hardware: What You Really Need

Trading Hardware: What You Really Need

Neon-lit trading computer components: case, motherboard, graphics card, memory, processor, power supply and cooling.
TradingPractical guide

Trading hardware:
What you need

Search for trading hardware and you soon get the impression that you need a futuristic office with four monitors, lights and a high-end computer. It looks impressive. But do you need a control room to trade? Probably not.

From case to graphics card: components are tools for your trading workflow.Image: TradeNeon

No control room.
A tool.
From the first question to two practical setups.
Show contents

How much technology do you need to trade? Less than the online pictures of control rooms suggest. A trading computer does not have to impress anyone. It needs to work reliably while you analyse charts and enter orders. Whether your current laptop is enough or a new workstation makes sense depends on your trading style and software.

The essentials

Choose your platform first and check its current system requirements. Then plan memory, an SSD, display connections and a reliable internet connection for your actual workload. There is no universal trading PC, monitor count or latency target for everyone.

01

Your style, not a catalogue, sets the direction

Before thinking about hardware, answer another question: how do you want to trade? Holding a position for one session or several weeks, using a heatmap or weekly charts — each changes your workflow. Your software and the number of views open at once define the technical demands more precisely than the labels “day trading” and “swing trading”.

Day trading: quick decisions, a reliable process

In day tradingIn day trading, positions are opened and closed again within a single trading day., you watch prices in real time and may keep charts, market data, an order book and order entry open together. The system should respond under your normal workload, and you should be able to enter an order without hunting through windows. A clear layout and a plan for connection problems help more than a desk with four impressive monitors.

Swing trading: room for research and planning

Swing tradingPositions are held over a period of days to weeks, sometimes even months. gives more room for research, analysis and periodic review. A reliable computer that runs charts, spreadsheets and browser windows smoothly may be enough. But tracking many markets, using multiple data sources or running extensive backtests also calls for spare capacity. The label “swing trading” does not mean that every ageing office computer will do.

Check each application before buying. NinjaTrader Desktop requires Windows and describes different needs for different workloads. TradingView Desktop supports Windows, macOS and Linux. For a Mac, compatibility with your chosen platform comes before any blanket device recommendation.

02

The components that matter

The processor, memory, storage and graphics each do a different job. What matters is whether they support your applications together. First see how your current device performs under a real workload; for a new purchase, you can allow room for more windows and data.

Processor

The processor handles charts, indicators and data. A current multi-core processor is a useful starting point. The old rule that clock speed matters more than core count is too narrow: NinjaTrader says it uses available cores and additional memory according to the workload.

Memory

Memory holds active applications and data. For a new computer, 16 GB is a sensible starting point; 32 GB may help with many charts, data sources or applications running together. These are planning ranges, not universal minimums: NinjaTrader, for example, recommends 8 GB for its desktop app.

Storage

An SSD for the operating system and platform makes sense. Capacity depends mainly on locally stored market data, replays and backtests. An NVMe SSD can move large datasets faster, but an existing SATA SSD does not automatically need replacing. Keep backups on a separate device or suitable backup service.

Graphics

Integrated graphics may handle charts and several displays if your device and ports support the required number and resolution. A dedicated card is not a universal requirement. For demanding graphics, check the application’s needs and test it under load.

An order flowOrder flow refers to the buying and selling of an exchange instrument as it happens in real time. workspace shows why the actual application matters: Bookmap explains how graphics support and refresh rate affect its display. A backtestIn a backtest, a trading strategy is applied to historical price data to check how it would have performed in the past. may instead load the processor, memory and storage. Test each with your own amount of data rather than relying on a generic components list.

03

Displays and connection

How much display space helps you?

One display may be enough for a focused or mobile setup. A second creates room if the chart, order entry and analysis need to stay visible together. A large ultrawide can do the same job. Three or more displays are useful only if you can still read and prioritise the extra information. Plan around your window layout rather than a fixed number.

With size and resolution, readability comes first. More pixels make room for charts, but scaling, viewing distance and font size decide whether you can see the details. Full HD may be enough; 4K is not a prerequisite. Check which resolutions and external displays your computer or dock actually supports.

Your connection is part of the setup

Live data and orders travel over your connection. For short-term trading, a wired connection can avoid Wi-Fi fluctuations when practical. A tested mobile hotspot or second connection may help during an outage. A blanket target of “under 30 ms” or a set download speed says little on its own about the reliability of your connection to the trading platform.

Test before a live order

Do the platform and data feed start reliably? Do charts stay responsive under your normal load? Is order entry easy to read? Do you know how to reach open positions during a power or internet outage?

04

Two setups for orientation

The original shopping lists gave specific models and shop prices. Those details date quickly. The profiles below show the decisions facing a research workstation and a desk with several live windows. They are neither minimum requirements nor ready-made shopping baskets.

ComponentResearch & swing tradingMultiple live windows & day trading
ComputerCurrent multi-core computer, 16 GB RAM as a starting point for a new purchase, SSD.Current multi-core computer; 16–32 GB RAM according to platform, data and parallel applications.
DisplayOne readable display, or a laptop with an external display if more space helps.Clear layout; second display or ultrawide if several windows need to stay visible.
GraphicsIntegrated graphics may suffice if ports and resolution fit.Choose graphics for the platform and displays; test demanding visualisations separately.
ConnectionStable access and a plan for interruptions.Wired if practical, with a tested backup connection and clear outage procedure.

If you prefer Apple

With Apple, you choose a finished configuration rather than interchangeable parts. A Mac mini or MacBook may suit a macOS-compatible platform. Check the software, memory, storage, external display support and dock before buying. A Mac is not a direct solution for Windows-only desktop software such as NinjaTrader Desktop without an additional Windows environment. Blanket advice for or against a MacBook Air, Pro or particular chip generation would miss the point.

And on the move?

A laptop can work for trading if it runs your platform and lets you focus under your normal workload. An external display may help but is not mandatory. Pay particular attention to screen size, ports, cooling under sustained load and your backup connection. A desktop is often easier to upgrade; mobility may still matter more to your routine.

A good setup does not need to look like a control room. It needs to fit your trading style, software and workplace. You can add many things gradually or buy them second-hand. Take your application list and window layout into your purchase research, and confirm compatibility with the provider.

TradeNeon Academy
Let your trading style guide the setup
If you want to explore which trading routine suits you, see the Day Trading and Swing Trading programmes. Both are currently taught in German. Your hardware choices can follow from there.
Common questions
Do I need two monitors for day trading?

No. A second display can help if you need several views at once. What matters is being able to see your chart and order entry clearly.

Can I trade on a laptop?

Yes, if your platform is supported, the machine runs reliably under your normal workload and the screen and ports fit your process.

Do I need a dedicated graphics card?

Not necessarily. Check your programmes and displays. Demanding visualisations may benefit from more graphics power.

Can I use a Mac?

That depends on your software. Some applications run on macOS; others require Windows. Check current system requirements and your complete workflow before buying.

Simon Reichert
Simon Reichert
Swing trading coach · TradeNeon
Simon Reichert is a swing trading coach at TradeNeon. He studied International Business Management, worked in finance and auditing, and has traded actively since 2022. His focus is swing trading, the broader market context and risk management.
Backtesting in Day Trading: Testing a Trading Idea with Data

Backtesting in Day Trading: Testing a Trading Idea with Data

An old film viewer on an editing table, with strips of film laid out in even rows in front of it and blank index cards and film cans beside it.
VideoATAS webinar

Backtesting in Day Trading:
Testing a Trading Idea
with Data

If you trade discretionarily, you make the decision yourself in the moment, and even so, the trading idea behind it needs a foundation of data. A backtest for discretionary day traders has two steps: first a statistical test with fixed rules in replay, then the discretionary execution. Here the process is walked through using the S&P 500 future in the ATAS replay.

The same idea, played through again and again and filed neatly. Only the quantity makes a statement possible.Image: TradeNeon

Key points first

A statistical backtest comes before discretionary trading: with clear rules that leave no room for interpretation, trades are collected in replay and recorded in a table with entry, result, maximum open profit and maximum open loss. After about 30 to 50 trades, a first feel emerges for whether the idea is heading in the right direction; 300 trades count as a “golden amount” for a first statistical statement, a value from experience rather than proof of a lasting edge. The table gives indications of where stops and position size might need adjusting, and the example shown is explicitly not a finished trading system.

01

The video

Playing the video connects to YouTube. Watch on YouTube

Chapters in the video 17

Click a timestamp to start the video at that point.

Video: ATAS DeutschlandMore videos from TradeNeon on our YouTube channel.

02

Why a statistical backtest comes first

There are two kinds of backtests. The statistical backtest comes first, even if you intend to trade discretionarily later. It answers a preliminary question: is the basic idea your trading system is meant to rest on heading in the right direction at all, and can an edgeA recurring advantage in the market that holds up over many trades and after costs and does not rest on chance. A backtest offers indications of it, not proof. be developed from it?

This calls for fixed rules. Unlike later in discretionary trading, they must leave no room for interpretation: if the market does this and this, it is an entry. If it does that and that, it is an exit, whether a stop, a certain market move or a span of time. The decisions in discretionary trading should still rest on market logic and a repeatable core idea later on. In the end, it always comes down to pattern recognition: you need something you can recognize and repeat.

03

Market analysis as the foundation of the trading idea

Before any backtest comes the question of where you want to trade in the first place. It starts with a market analysis: at which prices does institutional trading interest sit? Which factors do you include, such as volume profile, market profile, the footprint chartA chart that shows, inside each candle, how much was bought and sold at which prices., VWAP, dealer hedging data or dark pool data? Oliver Sparing works with his own levels from this analysis, available as the software Level of Interest. They are the basis for every system he develops.

When the market reaches one of these levels, it is already settled whether a trade is considered there and in which direction. Then a specific pattern is needed that has to be visible before buying or selling. Which data you use is your decision. “I personally consider level 2 data the biggest advantage you can have as a retail day trader, and I would not want to miss that data. But I am the last person to say that trading is not possible without level 2 data,” says Oliver Sparing, who trades the order book himself.

04

Using the replay properly

To collect the data, the replayThe playback of past market data in ATAS, which lets you practice and test as in live trading. function in ATAS is a good fit. “The replay function is your most powerful tool, especially when you are at the start of your trading career,” says Oliver Sparing. As of May 2025, the replay data, including order book data, came directly from ATAS. To practice and learn, you therefore did not need a paid live data feed from the beginning. Level 2 data is needed for the heatmapThe heatmap shows the order book over time: where limit orders sat and how large they were. in real-time use. ATAS now offers several replay modes with different data depth, and real-time data and replay are two different things. Which data your replay contains today, you are best off checking directly with ATAS.

Two warnings apply to the replay. First, speed: anyone who tests the strategy at a hundred times the speed takes the psychology out of trading, and psychology is exactly what often causes the biggest problems later. At points where a trade could come up, five times speed at most is advisable, preferably two times or real time. In fast-forward, sitting out a sideways phase costs no effort. In real time, the same phase drags on for twenty minutes and tests your patience.

Second, trading hours: you do not sit at the market twenty-four hours a day. So backtest only the time window in which you can actually trade in everyday life. Even if you see a good opportunity shortly before or after, it does not belong in the statistics, because in real time you would probably not have traded it.

05

The example idea: structure at a level

As an example, take a day in the S&P 500 future when the market sits in a bear zone, an area from the Level of Interest analysis. Bear zones and bull zones serve as part of the daily orientation and as a filter: in bear zones the focus is mainly on short trades, in bull zones mainly on long trades. Oliver Sparing trades this way in about 90 percent of his trades. There are exceptions, which are not covered here.

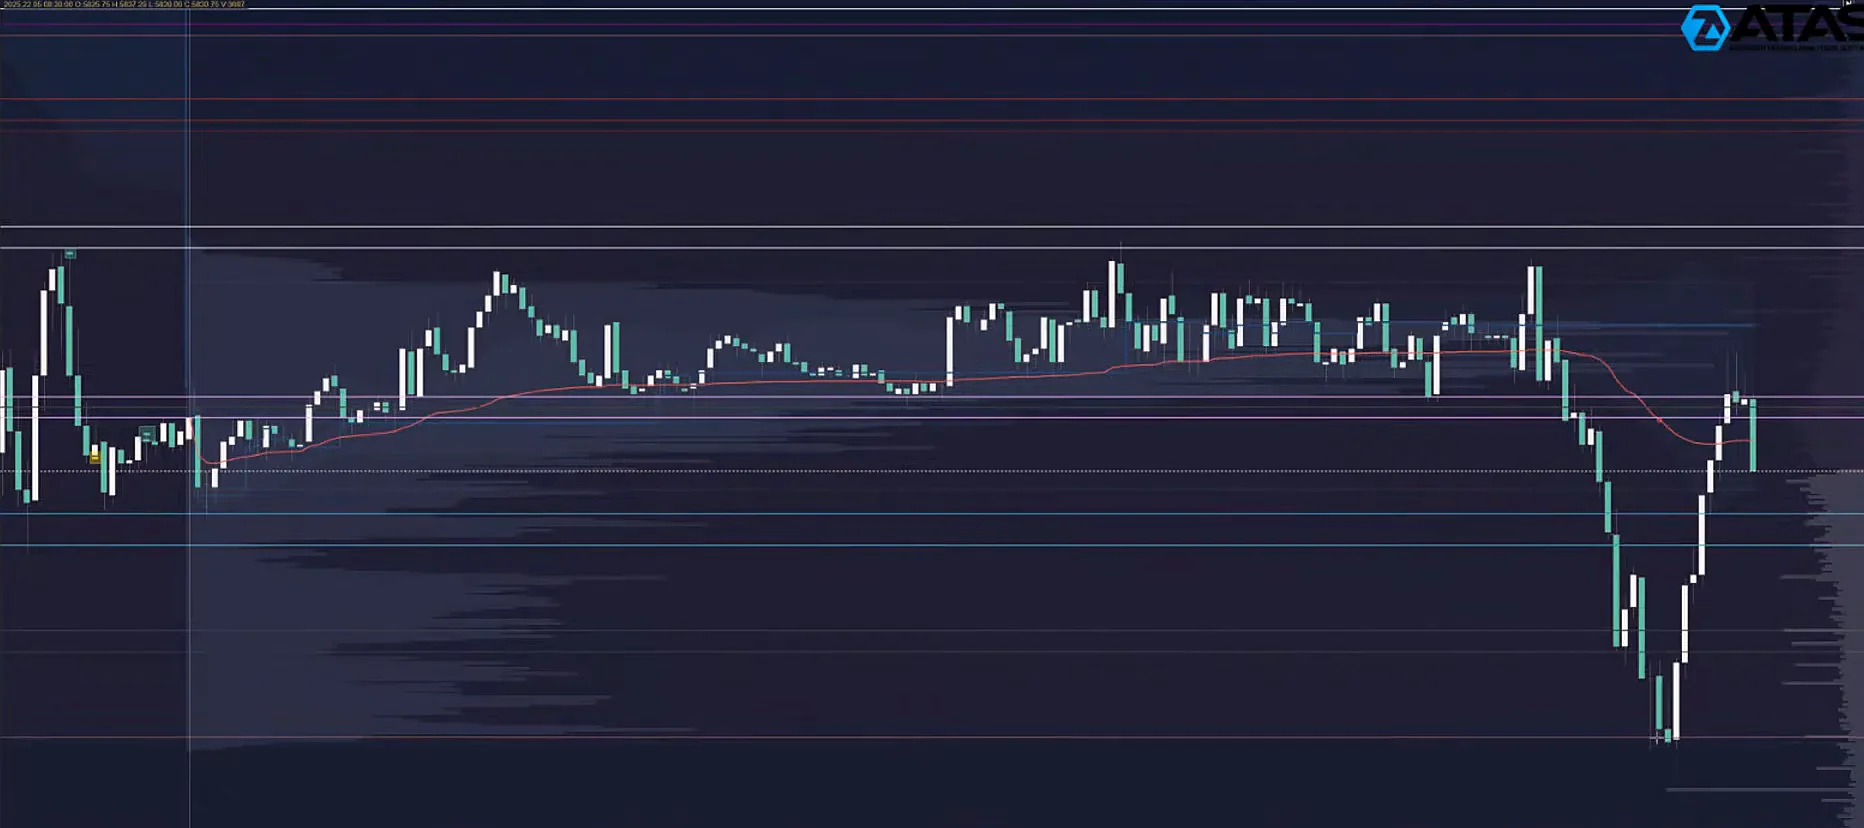
5-minute chart of the S&P 500 future on May 22, 2025 with a bear zone shaded in red. Overnight the price moves sideways between a purple-pink line and a volume profile level at 5,876, drops sharply shortly before the open down to the lower edge of the bear zone and bounces up from there.
The trading day on the 5-minute chart: the bear zone (shaded red) comes from the Level of Interest analysis and is derived from dealer hedging data. From minute 21:20. Image: ATAS Deutschland

The day unfolds like this: in the Asian and European sessions, the market moves sideways between the previous day's settlement price and a volume profile level at 5,876. Shortly before the open, it sells off sharply, runs down to the lower edge of the bear zone and bounces up from there almost exactly.

The rule for the test is kept deliberately plain. On the 5-second chart, the market runs into a level and forms a small structure. As soon as it makes a lower low, meaning it undercuts the last low, the test opens a short trade. In the bull zone, the reverse applies for long trades. The stop sits above the last high. If the trade moves in the desired direction, the stop is trailed above the last high with every new lower low. The trade ends when the market breaks that high to the upside.

An important point: this is not a finished trading system and not a recommendation to trade it this way. It is a coherent core idea from which a system can be developed. Money and risk management and position size play no role yet in the first, purely statistical pass. The calculation is done without slippage, and for the stop, the first aim is to find out in which range it should sit for this idea.

06

The evaluation table

The data belongs in a plain table. A professional trading journal looks different, as we show in our article How to Keep a Trading Journal. For a statistical backtest, five values are enough.

  • Date and time You record when the trade took place, in the example in New York time.
  • Direction You note whether the trade was long or short.
  • Result in ticks The result is recorded in ticksThe smallest price step of a futures contract. The result of a trade is often measured in ticks., even if the trade was stopped out.
  • Maximum open profit This is how far the trade moved in your direction before it ended.
  • Maximum open loss This is how far the trade moved against you after entry. This value is especially important.

The entry and exit price should also be noted. Partial profits that you take later in discretionary trading are entered separately in the table.

07

Two examples in replay

In the replay, two trades play out following this logic, both on the same trading day (May 22, 2025), the second at the previous day's settlement price and further levels. In the first case, the trade ends after a short time at the trailed stop, although in the course of it, it had been well further in profit. In the second case, the market runs through several levels in the desired direction, the stop is trailed several times, and the trade only ends at the trailed stop.

TradeResultMax. open profitMax. open loss
Trade 1 · 9:15 a.m. NY · short+1 tick+29 ticks−2 ticks
Trade 2 · 10:10 a.m. NY · short+63 ticks+121 ticks−4 ticks

These are two illustrative examples from the replay of May 22, 2025, calculated without slippage and costs. They are no proof of performance of the idea or of any strategy. The first trade shows how far the course of a trade and its result can lie apart: at one point it stood 29 ticks in open profit and ended at one tick. A stop of three ticks would have been enough to stay in the trade, because such a small open loss is rather unusual at this point.

5-second chart of the S&P 500 future with an order book heatmap in replay. A measuring box shaded in red spans from the entry to the exit at the trailed stop, and its label shows 63 ticks (15.75 points).
The second trade in replay: the measuring box runs from the entry to the exit at the trailed stop and shows 63 ticks (15.75 points). From minute 45:40. Image: ATAS Deutschland

Here the difference between replay and practice becomes visible. In accelerated replay, everything feels comfortable. In a real trade that is well in profit, your finger would probably often itch to take profits. “That ‘this is enough for me now’ is the end of every profitable trading system. If you take profits on a gut feeling, that is never good,” says Oliver Sparing. The statistical test, by contrast, deals with a purely mechanical idea that shows what the market actually offers in relation to the trading idea.

08

Evaluating many trades: 300 as a figure from experience

A sensible assignment is to evaluate at least 300 such trades. That is a lot of work, but it gives you a good feel for the market. The numbers are values from experience, not universal thresholds. After about 30 to 50 trades, a first feel emerges for whether the idea is heading in the right direction. If it turns out that there are almost only big losers and hardly any winners, the idea probably has no potential. If it is heading in the right direction, it is worth continuing. “300 trades are always a kind of golden amount, where you can really make a statistical statement about whether a system has potential,” says Oliver Sparing. That is not proof of a viable edge, and a historical test does not predict future results.

Even though it is tedious in practice, anyone who keeps the table up to date every day and has evaluated 300 trades usually knows the market much better and can make clearer decisions later.

09

What the statistics reveal about stops and position size

The table reveals a fair amount. Two examples: If it turns out that, on average, the trades run much further into open profit than what is left in the end, you are probably giving back too much profit. In discretionary trading, you then need to work on your stop placement, without taking away the room the trade needs and damaging the hit rate.

If, conversely, it turns out that winning trades rarely move far against you after entry, a much tighter stop would be conceivable. It might worsen the hit rate somewhat but sharply reduce the loss per trade. At the same time, position size could be scaled up. Evaluating the maximum values makes these relationships visible. The table gives indications here, for example for a tighter stop or a larger position size, but not yet proof that this adjustment works after costs and under other market conditions. Only the further test, the discretionary pass in the next section, shows that.

One more tip from practice: markets change, and a stop that is normal today can be too large or too small in half a year because volatility has changed. So do not shy away from larger stops if the market phase calls for them. With micro futuresSmaller versions of common futures with a fraction of the contract value, which allow position size to be adjusted more finely., you can reduce position size so that your risk per trade stays the same. How the risk per trade fits your account size, you work out with the contract's tick value: stop in ticks times tick value gives the risk per contract. In day trading, Oliver Sparing goes by 0.5 percent risk per trade; one percent is already too aggressive for him.

10

From the statistical to the discretionary backtest

If the first pass has shown that the idea has potential, the second part follows. You now trade the rules discretionarily and keep filling in the table, this time with the actual values: where would you have taken partial profits, where closed the rest of the position, how did the trade run under your management? On the basis of your stop, you choose the position size that fits your risk and enter the results. In the end, you see how the system performed under discretionary management.

In his own trading and in the day trading programme, far more factors interact: the order book, liquidity and its shifts, limit orders that come in or are pulled, the delta, the behavior of active market participants, price action, order flow events as well as market speed and auction speed. The example here is the core idea through which the process can be shown.

11

What you can take away from the webinar

  • Statistical first, then discretionary. Fixed rules with no room for interpretation show whether your idea is heading in the right direction at all.
  • The replay takes discipline. Test at a speed close to real time, and only in the time window in which you can actually trade.
  • Maximum open profit and open loss belong in the table. They give indications of where you give profits back and how tight a stop could be.
  • The amount of data counts. Around 300 evaluated trades are a figure from experience for a first statement about an idea's potential, not proof of an edge. Along the way, you get to know the market.

“Anyone who does not collect data will struggle to become profitable in the long run.”

Oliver Sparing on the statistical backtest (translated from German)
12

About the webinar

The webinar ran on May 29, 2025 on the YouTube channel of ATAS Deutschland and was hosted by ATAS. It is held in German; on YouTube, you can switch on machine-translated subtitles. ATAS is a trading platform for order flow analysis. Oliver is a regular guest there; you can find all appearances on our guest appearances page.

Day trading programme
How do you develop your own system?
In our day trading programme, you work on analysis, entries and risk management as one connected approach that fits your time and your temperament. The programme is currently offered in German.
Day trading programme (German)
Frequently asked questions
Why does a discretionary trader need a statistical backtest?

It shows whether your core idea is heading in the right direction at all and whether an edge can be developed from it. That only works with fixed rules that leave no room for interpretation. The discretionary execution follows afterwards.

How many trades should a backtest include?

There is no fixed number. Values from experience: after about 30 to 50 trades, a first feel emerges for whether the idea is heading in the right direction, and 300 trades count as a “golden amount” for a first statistical statement about the potential. These are not universal thresholds and no proof of a viable edge, and a historical test does not predict future results.

Which values belong in the evaluation table?

Date, time, direction, the result in ticks, the maximum open profit and the maximum open loss after entry. The entry and exit price should also be noted.

What should I watch for in the replay?

Choose the speed carefully: at points where a trade could come up, five times at most, preferably two times or real time, so that you keep a feel for the actual market speed. Also test only the time window in which you can actually trade in everyday life.

Oliver Sparing
Oliver Sparing
Founder & Head of Trading · TradeNeon
Oliver Sparing has been actively trading the financial markets since 2011. His professional roots lie in precious metals trading in Hamburg; in 2017 he learned at a London trading floor. At TradeNeon he leads the day trading and swing trading programmes and is responsible for the trading methodology, with a focus on order flow, market structure and fundamental market data. Level of Interest, Futures Insights and Lab of Trades grew out of this work. Platforms such as ATAS, Bookmap and WH SelfInvest regularly invite him as a guest. All guest appearances

Which Trading Style Fits Your Life?

Which Trading Style Fits Your Life?

A compass-headed figure stands where three different paths begin.
TradingOrientation

Which trading style
fits your life?

Swing trading and day trading differ mainly in their trading horizons. Options are instruments you can use in either approach. The question is which schedule, risks and learning commitment fit your life.

The compass represents a choice of approach and instrument. None of the paths guarantees a result.Image: TradeNeon

Your schedule sets the pace.
Risk belongs in the decision.
Six criteria help you compare trading styles and instruments without relying on promises.
Show contents

Finding your way into trading starts with orientation. You may want an activity alongside your job, or you may want to spend more time studying the markets. Before choosing an approach, ask how much time you can devote to learning and trading, and what loss you could afford to bear.

Scalping, day trading, swing trading, position trading and long-term investing differ mainly in their time horizons. That is a useful map: shorter trades often call for faster decisions. How demanding an approach really is also depends on the instrument, your rules and your preparation. OptionsOptions are time-limited contracts on an underlying asset. Buyers pay a premium for the right to buy or sell at a set price; sellers take on the corresponding obligation. are not another holding period. They can be used for short-term or longer-term positions.

The point to remember

A shorter trade is not automatically riskier, and a longer one is not automatically safer. There is no universal starting capital or dependable return range for a trading style. Compare your available time, ability to bear losses, product knowledge and entry and exit rules.

01

The role of education

Trading is a craft that takes time to learn. Information is abundant. The harder part is judging whether it is accurate, what you need to learn first, and whether a system shown online fits your life. Videos can provide a starting point, but they cannot replace practice or a method you understand.

I tried some systems promoted online in a demo account without finding a sustainable approach. That experience does not discredit all free learning resources. It shows why you should test a system before putting money at risk: What market logic supports it? How are losses managed? Are difficult periods discussed as well?

If you are considering training, get to know the people and their teaching first. A reputable provider gives you material that lets you judge the depth of its teaching, its treatment of risk and its teaching style. Even with guidance, you still need time to learn, test and practise your decisions. That applies to every approach below.

ScalpingScalping is a very short-term trading approach in which positions are often held for only seconds or minutes. often takes place within seconds or minutes. In day tradingIn day trading, positions are opened and closed within the same trading day., you close positions within the same session. Swing tradingSwing trading means holding positions for several days or weeks to capture an anticipated price move. allows an idea to develop across sessions; position tradingPosition trading means holding trading positions for weeks or months based on a longer-term market thesis. follows a longer-term market thesis. These boundaries provide orientation, not a guarantee of workload or results.

02

How much time can you devote?

Assess the time you have on an ordinary working day. Trading has to fit more than an ideal schedule. You need time for preparation, learning and review as well as the trade itself. Asking only how long a trade takes misses much of the work.

Day trading requires you to make focused decisions and monitor orders during your trading window. Hours spent are not a badge of quality: an hour without preparation may be insufficient, while a clearly bounded window can be part of a considered routine. The US investor education site emphasizes the risks of short trading intervals.

Swing traders often check the market and their open positions once a day. That can make a planned routine possible alongside work. Fifteen minutes a day is not a general measure of the time needed: finding setups, preparing orders and reacting to news may take longer. TradeNeon’s swing trading programme describes roughly 30 minutes of daily routine; learning may take longer.

Day trading calls for focused attention during a defined trading window. That does not necessarily mean eight hours at a screen. An hour may be enough for an experienced trader with a prepared plan; it may not be enough for learning, reviewing trades or every market day. The day trading programme is aimed at people who can devote one to three hours per day to trading. These figures describe the programmes, not every trader. Both programmes are currently offered in German.

For options, the particular strategy determines the time needed. A position running for several weeks requires different checks from a 0DTE option0DTE options are option contracts that expire on the trading day. on expiration day. A short life can demand close attention and quick decisions; it does not promise a higher return.

03

Which holding period fits?

Your holding period affects how long capital is tied up and when positions need attention. Swing trades may run for about five to 60 days. That is an example, not a fixed definition. Some positions end sooner; others call for more patience. Open positions remain exposed to news and price gaps overnight or over a weekend.

In day trading, you open and close a position within the same trading day. You avoid a planned overnight position. Prices can still move sharply during the session, and decisions and orders require active attention. No planned overnight exposure does not mean no risk.

Options have expiration dates, but using one does not define your trading style. An option held for longer may form part of a swing trading strategy; one opened and closed within a day may form part of day trading. Thirty to 45 days for some income strategies and 0DTE at expiration are examples of different lifetimes, not a third discipline between day and swing trading.

04

Which capital can you afford to risk?

A blanket figure such as “€5,000 for day trading” or “€10,000 for swing trading” is not a market standard. Capital needs depend on the instrument, contract size, costs, potential loss and position size. Money needed for living expenses and essential reserves should not be put at risk.

Keep trading capital separate from money for ongoing costs and long-term goals. Treat long-term investments separately from active trades. That helps you avoid covering a trading loss with money needed elsewhere.

A small margin requirement is not the same as a small maximum loss. With leveraged products, the important question is how a market move affects your account. Our position sizing and risk management article shows how to work through this before a trade.

In swing trading, a stop placed farther from entry can put more money at risk per unit. A smaller position or another instrument can change the risk per trade. In day trading, a shorter price move may mean a smaller loss per contract, but costs, leverage and an oversized position can outweigh that difference. External capital is no substitute for calculating your own risk.

There is no universal €5,000 or €30,000 entry point for options positions either. Buying or selling, coverage, contract size and possible margin calls make a substantial difference. A premium received is not money earned without risk.

Programme requirements, not blanket rules

TradeNeon’s current training pages give starting amounts of €3,000 for the swing trading stock systems, €10,000 for their options systems, and at least €5,000 of own capital for the day trading programme. These are programme-specific figures; they do not replace a review of your financial situation. The programmes are currently in German.

05

Which instruments suit you?

Swing trading can use stocks, futures or options, for example; depending on the approach, day trading may also use futures or options. An instrument is neither liquid nor suitable simply because of its name. Check the venue, contract terms, costs and the size of a potential loss.

Standardised exchange-traded instruments and off-exchange products may differ in their pricing and contract terms. For each product, check the trading venue, counterparty, costs and possible conflicts of interest.

Buying an option gives you a time-limited right. Selling one creates an obligation. Potential losses depend strongly on whether you buy or sell, whether the position is covered, and the underlying asset. FINRA explains these differences; a premium received is not guaranteed profit.

With 0DTE options, price and risk can change rapidly before expiration. The Options Industry Council explains the mechanics and risks. A short expiration does not imply a higher chance of profit or less need to monitor the position.

TradeNeon’s former supported options trading course is not currently offered. This article therefore compares options as an instrument without pointing to an unavailable course. The current Lab of Trades options systems are linked in the box below.

Options in the Lab

Rules-based options systems

Argon presents the current options systems at Lab of Trades. Compare each strategy's requirements, costs and risks.

Explore Argon →
06

Which expectations are realistic?

Blanket annual return ranges offer neither a dependable expectation for you nor a picture of possible losing periods. More risk does not automatically bring more return. The useful question is whether you understand a method's rules and can assess its results after costs and losses.

One account, system or backtestA backtest applies predefined trading rules to historical data. It does not demonstrate future profit. says little about what another person will achieve after costs and losing periods. Look beyond good months and ask about difficult periods and the size of interim losses.

Statistical options strategies in particular may go several weeks or months without a gain. A fixed set of rules does not remove every decision or prevent losses. In discretionary day or swing trading, judging the current market plays a larger role in your work. Ask what mistakes and losing streaks you would have to withstand with any approach.

07

Which risks fit your circumstances?

Trading should only involve capital whose loss would not threaten your living expenses. A demo account helps you learn processes and identify technical mistakes; it does not prove you will make the same decisions with real money. Market logic still matters: you should be able to explain why you enter a position, what would invalidate the idea and what loss you planned for beforehand.

LeverageLeverage uses borrowing or derivatives to create a larger market position than the capital committed. It can amplify gains and losses. does not make a strategy “capital efficient” in the sense of safer: it magnifies the effect of a market move. A planned stop expresses your intended loss limit, but a price gap or rapid execution can lead to a different fill. Before entering, assess what loss you can actually bear and how you would continue after a losing streak.

Losing trades cannot be ruled out. Position sizing, a risk limit and a record of your decisions can give your actions structure. They make risk more manageable without removing it. Whether a method suits you also depends on your ability to follow its rules through difficult market periods.

08

Find your way

The choice is not about picking a label. It depends on your daily life, finances and the way you make decisions. Take time to assess the trading horizons and the possible instruments separately.

  1. When can you watch markets and check orders regularly, not only on an ideal day?
  2. How long can capital remain tied up, and what happens after an overnight price gap?
  3. How much money is genuinely free after reserves and ongoing obligations?
  4. Do you understand contract value, costs, expiration and the instrument’s loss profile?
  5. What market thesis brings you in, and what would prove it wrong?
  6. How will you practise and document decisions before risking real capital?

If you want to study longer moves with a scheduled routine, start with Swing Trading Alongside Your Job. If you are considering a focused trading window, read Learning Day Trading: Which Path Fits?. Both are starting points for learning and review, not promises of suitability.

Lab of Trades
Semi-automated trading systems
Lab of Trades runs ready-made, rules-based trading systems at your broker account. The software monitors the market and prepares the order. You decide whether to execute it with a click.
Explore Lab of Trades
Common questions
Is swing trading always better for people with a job?

No. A scheduled routine may fit around work, but open positions, learning and risk management still take time.

Is day trading safer because positions do not stay open overnight?

No. Avoiding a planned overnight position does not remove market, execution or loss risk during the session.

Is options trading its own trading style?

Options are instruments with an expiration date and contractual rights or obligations. They can be used within different styles.

What return can I expect?

A trading style alone cannot establish your personal return. Assess the method, costs, risks and evidence without a profit promise.

Simon Reichert
Simon Reichert
Swing trading coach · TradeNeon
Simon Reichert is a swing trading coach at TradeNeon. He studied International Business Management, worked in finance and auditing, and has traded actively since 2022. His focus is swing trading, the broader market context and risk management.
Day Trading with the Order Book: How Prices Move

Day Trading with the Order Book: How Prices Move

A dark building is shown in cross-section, with several open floors and thick ceilings.
VideoWH SelfInvest webinar

Day Trading with the Order Book:
How Prices Move

At first glance, the order book can feel overwhelming, yet it follows a logic you can trace. That logic starts with the question of who moves the price and runs through the heatmap and the DOM, absorption and delta, to the five factors to check before every trade. The order book comes last: market analysis first decides where it is worth looking into it.

To move up, price has to break through the ceiling. The order book shows how thick it is.Image: TradeNeon

Key points first

The order book comes last: first you set the zone you want to trade through your market analysis, and you look at the book when the market arrives there. The heatmap and the DOM are two tools for the same data. What you see in them, absorption for instance, remains an interpretation rather than proof, because anonymous order book data does not show who is trading. Five factors serve as a checklist before every trade: active market participants, passive market participants, market and auction speed, market structure and order flow events.

01

The video

The video is in German. For English audio, open the settings (gear icon) in the player and choose Audio track → English.

Playing the video connects to YouTube. Watch on YouTube

Chapters in the video 20

Click a timestamp to start the video at that point.

Video: WH SelfInvest DeutschlandMore videos from TradeNeon on our YouTube channel.

02

Why the order book needs structure

The order book is on everyone's lips again. Earlier, even retail investors had hardly any insight into the depth of the market; today, they have plenty of information and tools at their disposal. That is exactly what makes the start hard: what is relevant, what is not, what should I focus on?

Host Stefan Fröhlich adds that an approach should be based on logic and be repeatable without becoming too complicated. From support, he knows platforms packed with lines and indicators, where you quickly get lost in the details. The order book itself is less complicated than it looks: once you have understood the concept and the basic idea, you can see the logic behind the hustle and bustle.

03

Market, limit and stop orders

Who actually moves the price? There are two basic order types: with a market orderAn order that is executed immediately at the next available price. It is filled by a limit order., you accept the best available price. A limit orderAn order with a price limit: a maximum price when buying or a minimum price when selling. It waits in the order book until a market order fills it., by contrast, is a bid: a maximum price you pay as a buyer or a minimum price you accept as a seller. On top of that come stop ordersAn order that is triggered as soon as the stop price is reached. A conventional stop order then becomes a market order (not so with stop-limit orders)., which only become active once the stop price is reached.

CriterionMarket orderLimit orderStop order
What you setNothing but the quantity.A maximum price when buying or a minimum price when selling.The stop price.
ExecutionImmediately, at the best available price.Only once a market order fills it, possibly not at all.Once the stop price is reached, the conventional stop order becomes a market order and takes the next available limit price in the book.
In the order bookNot visible, it takes liquidity.Sits visibly in the bid or the ask.Does not sit in the public book until triggered and only appears in trading as a market order after it is triggered.

What matters is how they interact: market orders are always filled by limit orders, and limit orders as a rule by market orders. Whoever buys at market is filled by a limit seller, and whoever sells at market by a limit buyer. Stop-limit orders are deliberately left aside here.

04

Bid and ask

The order book has two sides. The bidThe buy side of the order book: all limit buy orders. contains all limit buy orders, the askThe sell side of the order book: all limit sell orders. Also called offer. all limit sell orders. Bid and ask are never at the same price but at least one tick, one cent or one pip apart. The highest price offered by buyers and the lowest price asked by sellers have to differ because limit orders are not filled by limit orders.

05

The skyscraper image: ceiling and floor

The skyscraper image explains how prices rise or fall: you are a little figure in a skyscraper. If you want to go up one floor, which stands for a rising price, you have to drill through the ceiling. The ceiling is the limit sell orders in the ask. If you want to go down, you drill through the floor, and that consists of the limit buy orders in the bid.

Ceiling and floor can be of different thickness. If there are 100 contracts at the next price of the ask and only 10 in the bid, it takes clearly more market buys to make the price rise than market sells to make it fall. The problem for you as a trader: you never know how thick the ceiling really is. Whoever sits on the floor above can be a large institutional market participant, such as a fund or a large hedger. Anonymous order book data, however, does not let you tell. Whoever it is: while you work your way through the ceiling with your market orders, new limit sell orders can keep being added and thereby patch up the ceiling.

06

Buyers and sellers: active and passive

A common misunderstanding, especially on the topic of deltaThe difference between market buys and market sells at a price.: there can never be more buyers than sellers or the other way round. Every transaction always has two sides. They proceed differently, though. Aggressive buyers and sellers open their orders with market orders; they accept the next best price. Passive market participants place limit orders in the book and wait.

For the price to jump to the next level, the entire limit order quantity at the current price has to be worked through. If an aggressive buyer comes with a larger order, they run through several prices and can make the price rise further. What sits in the book is visible to everyone in a standardized, regulated market such as futures, stocks or options, and everyone sees the same trading volume. What is not visible is whether and how many institutional participants sit in the background and how willing they are to patch up the ceiling again and again. You can work with that if you know what to watch for.

07

Heatmap and DOM: tools, not camps

The webinar puts two visual forms of the order book side by side: the heatmapA historical recording of the order book. The warmer the color, the larger the limit order at the price. on the left, the classic DOMDepth of market, the classic order book. It shows in real time how many limit orders sit at the individual prices. (depth of market) on the right. Camps form quickly in the trading world, team heatmap against team order book or team RSI against team MACD, and everyone considers their own approach the only right one. The advice is to stay neutral: both are tools for data visualization with their own strengths, weaknesses and areas of application.

The DOM basically shows the same data as the heatmap, but in a different way, and you can take different information from it. One does not rule out the other; the two tools complement each other. Everyone has to decide for themselves which they get along with better or whether they use both. That applies to all concepts in trading.

Split screen: on the left the heatmap (Bookmap) of the ES future with price history and brighter lines for larger limit orders and a volume profile along the right edge, on the right the DOM with a blue bid side, a red ask side and the number of contracts at each price.
Visible: on the left the heatmap (Bookmap) of the ES future (December 2024 contract) with price moving around 5,780 to 5,790. Brighter lines stand for larger limit orders, and a volume profile runs along the right edge. On the right the DOM with bid (blue) and ask (red) and the number of contracts at each price. The reading in the webinar: the same data, once as a history over time, once as a snapshot per price. From minute 23:40. Image: WH SelfInvest Deutschland
08

Institutional traders and dark pools

A thought experiment with the skyscraper image shows how large market participants deal with the order book: a trader is supposed to buy 100,000 contracts of the ES future over the course of the day. With a single market order, they would work through the entire book, drive the price up and make their own average price worse. A huge limit order would be visible to everyone, and front-running algos would buy ahead of it.

So they build the position piece by piece, over a day or, with even larger orders, over several weeks, with a mix of market and limit orders or with hidden iceberg ordersHidden limit orders: only part of a large order is visible in the order book.. The fewer other market participants notice them, the better: they want to move the price as little as possible and buy as cheaply as possible.

Side note: what dark pools are

dark poolsAlternative trading venues for securities, above all stocks and ETFs, supervised in the US by the SEC as alternative trading systems. Large market participants trade there largely anonymously and without a public order book. Executed trades are reported, with size and price. are alternative trading venues for securities, above all stocks and ETFs. In the US they are supervised by the SEC as “alternative trading systems”. ES futures are not traded there. In the webinar, the futures example and the dark pools are covered in one train of thought. Here we keep the two apart: the common point is the approach of large market participants to leave as few traces as possible in the public order book. For futures, the CME has its own procedures for large orders, such as block trades.

Dark pools give large trading parties the chance to trade largely anonymously and without a public order book, with as little influence on the price as possible. Off-exchange trading can still affect price discovery, though. Often only part of a large order runs through dark pools, the rest through the official exchange. Executed dark pool trades are reported and show up in the trading data, with size and price but without an indication of whether the buyer or the seller took the initiative.

For traders, that has value: in the normal order book, you never know whether an order comes from an institution or from a larger retail trader. With dark pool data, it is different: “With dark pools, we always know for certain that guys with big wallets are involved,” says Oliver. You can find more about the data in our video article on dark pools.

09

Volume profile and fair price

More important than the dark pools themselves is the approach of institutional traders: they need liquidity and want to trade at prices that buyers and sellers consider fair. The volume profileShows at which prices a lot or little volume was traded within a time span. shows this. It does not show how much volume was traded on which candle but at which prices within a time span a lot or little volume was traded. In the middle of the profile, where a lot of two-sided trading took place, a large market participant quickly finds a counterparty without moving the price much.

The further price rises, the less trading interest there is. In the premium area, the price becomes attractive for sellers, but fewer and fewer buyers still see it as fair. Downward, it is the other way round in the discount area. A basic idea of auction theory: price usually comes back to its fair value in the middle. That is not a general rule; price can also find a new area, for instance when news fundamentally changes the situation. In day trading, there is a second reading: an institutional trader might have built up enough position in the sideways range and wait until the market runs into the premium area. Then they place many market orders into the market, drill through the ask and let the market break out. This is only a look at the surface of auction theory.

10

The DOM

The DOM, short for depth of market, shows you the market depth. For that, you need a level 2 market data feed, meaning a data provider that shows what sits at the individual prices in the market. Such feeds cost money, come from the exchange and are redistributed by various providers. A professional feed is advisable because the providers do differ in quality, and patchy data are no good for this way of trading.

In the DOM, the bid side is blue and the ask side is red. In real time, you see how many contracts sit at a price and how the value changes. That applies to everyone alike, standardized and regulated, which is very advantageous for retail traders. Clusters stand out where clearly more limit orders sit than on average. What you do not know is whether the market arrives there, works through the contracts and the same quantity is added at that very moment. That is absorptionLimit orders are worked through and immediately replenished, so that price does not get through..

11

The heatmap

The heatmap is a historical recording of the order book. It makes it easier to understand what happened there without having to keep an eye on every single price. The warmer the color, the larger the limit order at the price. The big advantage: you see how long an order has already been in the market and how it has developed.

In the example from the webinar, a large order at 5,800 has been sitting there all day and even the day before. Because it has a certain size and has been sitting for so long, there is a lot to suggest that it is real. That is not a sure sign, because an order can be canceled at any time until it is executed.

12

Real and displayed orders

The biggest criticism of the order book is at the same time one of its biggest advantages: you never know in advance whether an order is real. It is possible that someone places an order for 500 contracts in the book to feign trading interest and pulls it out again as soon as the price approaches. As long as an order is not executed, it can be canceled at any time, even by large institutional traders. A visible order still creates interest and influences market participants, even if it disappears later.

Be careful with interpretation: the fact that an order is later canceled does not prove spoofing. Whether there was intent to deceive behind it cannot be read from the order book. Spoofing is prohibited at the CME.

One therefore distinguishes between orders that prove to be real and those that are not. In the example, a large limit order at 5,780 proved to be real: it sat in the market for a very long time, and when price arrived there, many market buyers ran into it, worked through it completely, drilled through the ceiling and rose to the next prices.

13

Absorption and delta in the heatmap

According to theory, price should rise in a balanced order book when more market buys than market sells take place. That is the difference, the delta. In the heatmap, white bubbles stand for market buys and turquoise ones for market sells. In most upward moves, the white ones dominate; in most downward moves, the turquoise ones.

In the example, it goes differently: the market reaches a price area again and again, the white bubbles are clearly larger than the turquoise ones, and still the price tips back every time. One possible reading of the pattern: on the other side sit limit sellers who absorb the market buyers and keep adding new limit orders, like fresh concrete on the ceiling. This happens algorithmically and in milliseconds today but can be traced well afterwards in the heatmap. That is an interpretation of the pattern, not proof of who is trading there. At some point, the question arises which side has the bigger wallet.

Heatmap of the ES future from October 8, 2024: price runs up to the area around 5,790 several times, white and turquoise circles mark market buys and market sells, and at the end price falls to about 5,785.
Visible: heatmap of the ES from October 8, 2024. Price runs up to the area around 5,790 several times, white circles (market buys) are partly larger there than the turquoise ones (market sells), price does not get through and falls to about 5,785 at the end. The reading in the webinar: limit sellers absorb the buys and add more, and at some point the buyers run out of steam. That is an interpretation of the pattern, not proof of who is trading. From minute 51:30. Image: WH SelfInvest Deutschland

If the market buyers are stronger and the sellers can no longer add, a fast sweep up through the book often follows, because many stop orders are triggered along the way. That is a tendency, not a certainty. In the example, the opposite happens, and the interpretation is: the buyers run out of steam, they are fully invested and cannot add anymore. For market sellers, it is then straightforward to push the market through the thin floor. That is called exhaustionOne side runs out of strength, so that the market can run in the opposite direction..

At the beginning, the rule is: do not try to see absorption, an iceberg order or spoofing around every corner. These things happen in the order book all the time. That is why the most important thing is to think before the session about where you want to trade at all.

14

Market analysis first

It starts with market analysis: “Every professional day trader I have met in my career who trades from the order book thinks about market structure before the session,” says Oliver Sparing. The methods differ: dealer hedging levels, gamma and vanna levels, dark pool levels, Fibonacci retracements or classic technical analysis. Here too, many roads lead to Rome. What matters is that you have thought about where institutional trading interest sits and where your best entry opportunities are.

Only when the market comes to such a zone do you look at the order book and watch how the market participants interact there. An example is an uptrend with higher highs and higher lows: the market breaks through an important level, later comes back to this zone, and you want to trade a reversal in the direction of the trend there. That applies on all time frames, although delta on the daily chart does little. That is something for day trading.

15

Delta as a prerequisite for the trade

What you look at first in such zones is the delta. Every trading decision should be supported by active market participants. Active buyers and sellers do not have sole power, because they can be absorbed, but they fundamentally move prices. Whoever wants to go long or short wants active participants on their side before entering.

An example: active sellers push the market down and are filled by limit buyers. Perhaps there is a level where they are absorbed. But as long as no active buyers reappear and show interest, no amount of absorption is enough for an entry: “As long as they are not there, any amount can be absorbed, I would never enter a trade,” says Oliver.

16

Five factors before every trade

Even more important than the active participants is what the passive ones do. That is very extensive and complex. At the end come five factors that are taught in the programme and that you think about before every trade.

  • Active market participants What is the delta doing?
  • Passive market participants How do the limit orders in the book shift? Here the heatmap has the advantage, because it records when orders appear, are pulled or are moved.
  • Market and auction speed Market speed says how fast the market moves from price to price, auction speed how many orders run through the book at what frequency. Here the classic DOM has the advantage.
  • Price action and market structure Where are the prominent highs and lows, on higher time frames as well as in the microstructure?
  • Order flow events Was there absorption, iceberg orders, stop runs, exhaustion or a sweep? Were market participants caught in their stops?

At first, you can go through these points in your head before the trade or even write down what you saw. Order book traders make their trading decision on this basis. All of this is only rough and is meant to give a first impression.

17

Questions from the chat

Do you only see the limit orders in the DOM, or the market orders as well? The answer in the webinar: in principle only the limit orders. Depending on the DOM, you can set it to show in the middle how much was actually traded at the individual prices. The footprint chart goes a step further and shows per candle how many orders were traded at which prices. That is a different topic.

The webinar names no book specifically on the order book: the basics book “Das komplette Börsengrundwissen” is too general for that, and host Stefan Fröhlich does not know of any either. On order book trading, Oliver says: “It is a craft, and I am firmly convinced that anyone can learn it. It is certainly not for everyone, but you should treat it as vocational training. There are really a lot of great people out there who do this well.”

18

What you can take away from the webinar

  • Prices move when market orders work through limit orders. Ceiling and floor are of different thickness, and you never see for sure how much gets added behind them.
  • The heatmap and the DOM are tools, not camps. They show the same data in different ways and complement each other, and you decide which you get along with better.
  • The order book comes after the market analysis. You look at it when the market runs into a zone you determined beforehand through institutional trading interest.
  • Five factors before every trade. You go through active and passive market participants, market and auction speed, price action and order flow events before you enter.

“Every transaction that takes place on the exchange always has two sides, a buyer and a seller.”

Oliver Sparing in the WH SelfInvest webinar (translated from German)
19

About the webinar

The webinar ran on October 10, 2024 on the YouTube channel of WH SelfInvest Deutschland, hosted by Stefan Fröhlich. WH SelfInvest is a broker. It is held in German; on YouTube, you can switch on machine-translated subtitles. Oliver is a regular guest there; you can find all appearances on our guest appearances page.

Note: the video is a recording from 2024. Brand and company names as well as offers in the video reflect the status at that time.

Day trading programme
How does the order book fit your trading?
Reading the order book is a craft that you learn step by step. In our day trading programme, you learn to put it into context with your market analysis. The programme is currently offered in German.
Day trading programme (German)
Frequently asked questions
What is the difference between the heatmap and the DOM?

The DOM is the classic order book and shows in real time how many limit orders sit at the individual prices. The heatmap records the order book over time: the warmer the color, the larger the order, and you see how long it has already been sitting there. Both show basically the same data, but in different ways, and complement each other.

Why does the price not rise even though more market buys take place?

On the other side, limit sellers can absorb the market buyers: each time the existing orders are worked through, they add new limit orders. Price then does not get through until one side runs out of strength. That is one reading of the pattern; order book data alone does not show who is trading there.

Can you trust every order in the order book?

Not without further checks. As long as an order is not executed, it can be canceled at any time. With a large order that has been in the market for a long time, there is a lot to suggest that it is real, but that is not a sure sign. The fact that an order disappears does not prove spoofing either: whether there was intent to deceive behind it cannot be read from the order book. Spoofing is prohibited at the CME.

What do dark pools have to do with the order book?

Dark pools are alternative trading venues for securities, above all stocks and ETFs; ES futures are not traded there. What they share with the order book is the approach of large market participants to leave as few traces as possible in the public order book. Executed dark pool trades are reported and show up in the trading data with size and price, but without an indication of whether the buyer or the seller took the initiative.

Oliver Sparing
Oliver Sparing
Founder & Head of Trading · TradeNeon
Oliver Sparing has been actively trading the financial markets since 2011. His professional roots lie in precious metals trading in Hamburg; in 2017 he learned at a London trading floor. At TradeNeon he leads the day trading and swing trading programmes and is responsible for the trading methodology, with a focus on order flow, market structure and fundamental market data. Level of Interest, Futures Insights and Lab of Trades grew out of this work. Platforms such as ATAS, Bookmap and WH SelfInvest regularly invite him as a guest. All guest appearances