Learning day trading: which path is right?

Learning day trading: which path is right?

Dark Pools in Trading: What the Data Shows

Dark Pools in Trading: What the Data Shows

A dark pool of water in a vaulted hall: heavy stone blocks lie beneath the surface, and only ripples are visible on top.
VideoATAS webinar

Dark Pools in Trading:
What the Data Shows

Many large orders are executed on trading venues without a public order book. Dark pools are regulated, their trades are reported with a delay, and the data shows price and volume but not direction. This article explains what dark pools are, what their data reveals and how dark pool levels in crude oil and S&P 500 futures can be factored into trading plans.

Large orders stay below the surface. They only become visible later, through the traces they leave.Image: TradeNeon

Key points first

Dark pools are regulated, private trading venues where institutions execute large orders without showing them in the public order book. Trades are reported with a delay. The data shows price and volume, but not whether the trade was a buy or a sell. As a level on the chart, it is a starting point for watching the order book, not an entry on its own.

01

The video

Playing the video connects to YouTube. Watch on YouTube

Chapters in the video 11

Click a timestamp to start the video at that point.

Video: ATAS DeutschlandMore videos from TradeNeon on our YouTube channel.

02

What dark pools are

Dark pools are private trading venues. They exist alongside public exchanges such as the NYSE, but without a public order book and without real-time quotes. They emerged in the 1980s to execute large orders discreetly. They are usually operated by large banks and fund companies.

The name sounds like a shadow exchange. That image is wrong: dark pools are regulated, and every trade executed there has to be reported to the authorities.

03

Why institutions trade in dark pools

A hedge fund that wants to buy 10,000 ES contracts cannot send that order to the public order book as a market order. It would move the price against itself. Large market participants therefore split their orders and bring them into the market as inconspicuously as possible.

In a dark pool, buys and sells are matched algorithmically at the midpoint price, known as midpoint matchingBuys and sells are matched at the midpoint between the best bid and the best ask.. This reduces slippageThe difference between the expected price of an order and the price at which it is actually executed. and protects against front-runningOther market participants trade ahead of a detected large order to profit from its impact.: a large limit order in the public book would be spotted by algorithms, and the market might turn away from it beforehand. For retail traders, the downside is lower transparency. They have no direct access to dark pools.

04

What the data shows and what it does not

Operators report trades after execution with a delay, in the US usually within ten seconds, in some cases only on the next day. In Europe, trades often only have to be reported after 24 hours. At the latest by the following day, you can see as a retail trader, too, at what price level and in what volume large orders were executed.

Such a printThe report of an executed trade, with price, volume and time. does not reveal whether the trade was a buy or a sell. Every trade has a buyer and a seller. The intent also remains open: not every institutional trader is speculating. Some hedge positions, rebalance a portfolio or trade for tax reasons.

On its own, dark pool data is not enough. It gains weight only in combination with other factors, such as dealer hedging data or the CME's SPAN data. “With dark pool data in particular, it is very important to always combine it with other factors and generate an edge from that,” says Oliver Sparing. Access comes from delayed, publicly available FINRA reports and paid data platforms. In our software Level of Interest, we analyze the data every morning and draw the dark pool levels we consider relevant directly onto the chart.

05

Two examples from the ATAS replay

Two situations from the same week, recorded with the replay function of ATAS and the order book heatmapThe heatmap shows the order book over time: where limit orders sat and how large they were., show how a dark pool level can be observed in practice.

Crude oil future (CL)

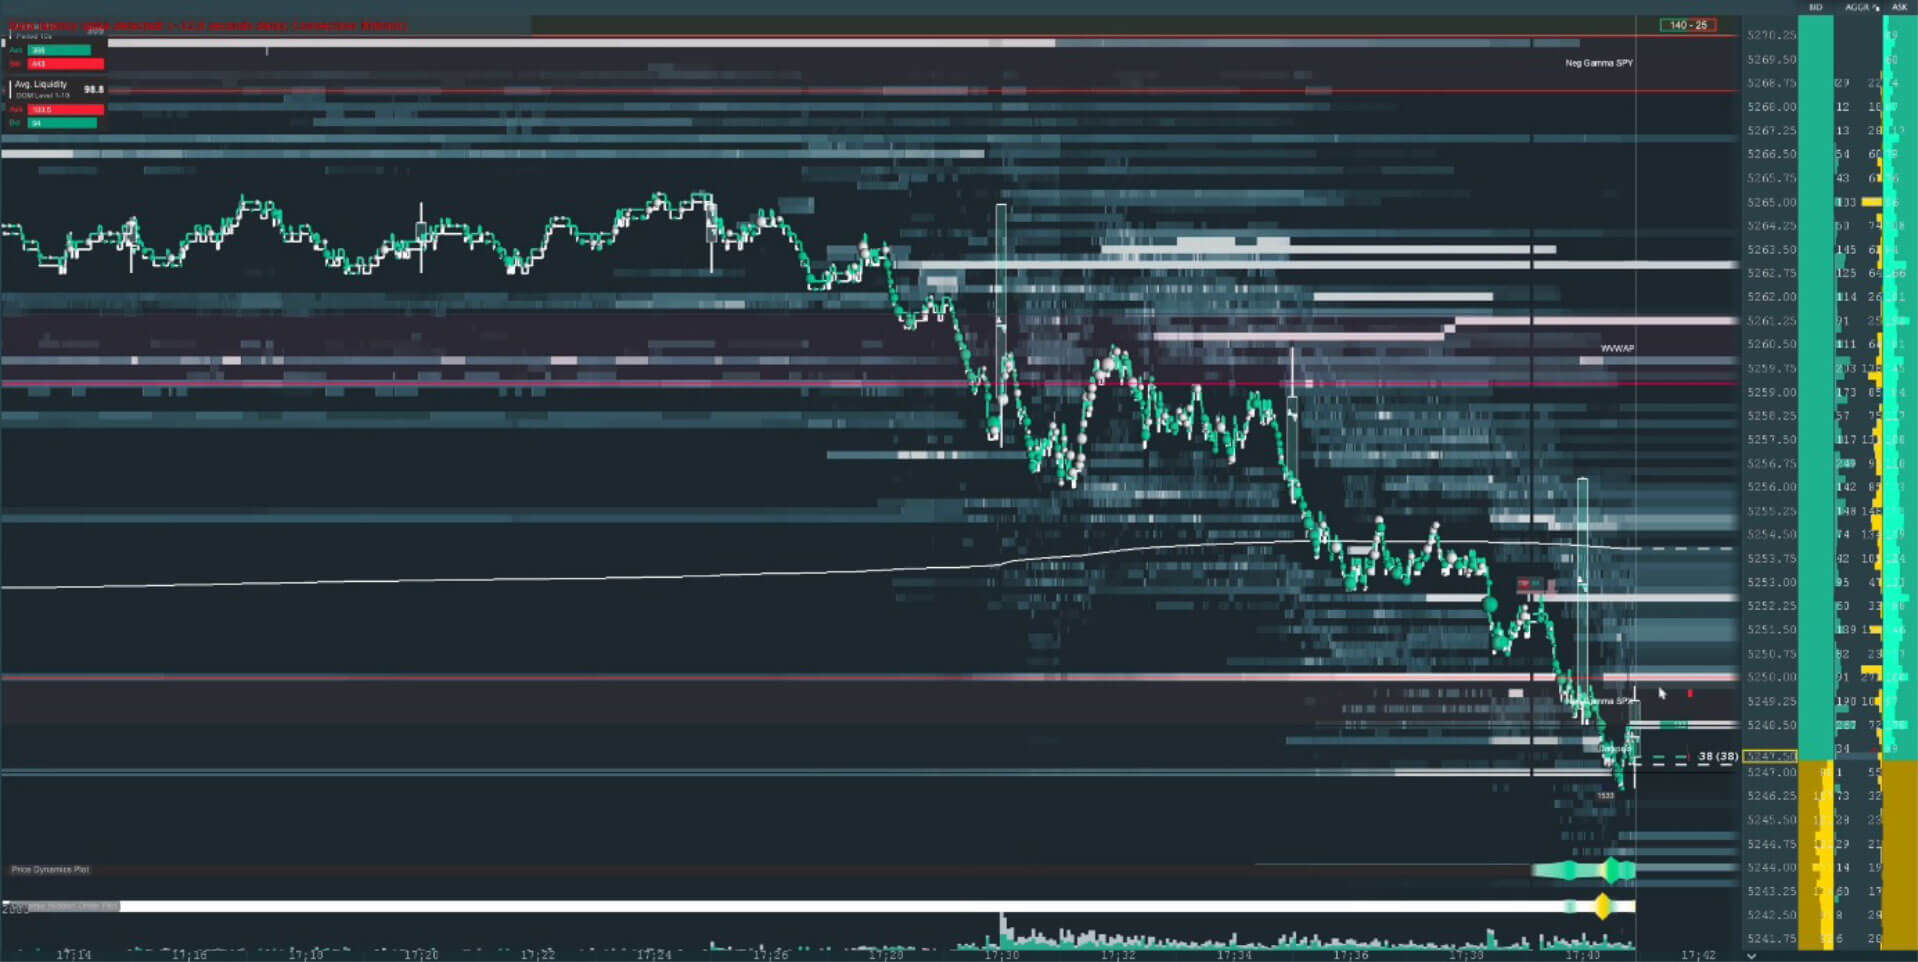
On the previous day, an unusually large order had traded in a dark pool below the previous day's low, and the market rose afterwards. The assumption: a larger buyer had positioned there. When price came back into the zone, the order book showed large limit orders at the dark pool level and at the settlement priceThe official settlement price of a futures contract at the end of the trading day. above it. Both were filled, new buy orders kept arriving below the level, and price eventually broke out above the settlement price.

In this situation, the settlement price sat as resistance above the level. Had a setup formed close to that resistance, the trade would have had little room in the intended direction, and then this applies: “If there is resistance right in front of me, I do well to be patient and not enter the trade prematurely,” says Oliver Sparing.

Order book heatmap of the crude oil future in the ATAS replay: bright horizontal lines show large limit orders, and price runs down into that area.
Crude oil future (CL) in the ATAS replay: the heatmap shows large limit orders as bright lines. Still from the webinar, minute 37. Image: ATAS Deutschland

S&P 500 future (ES)

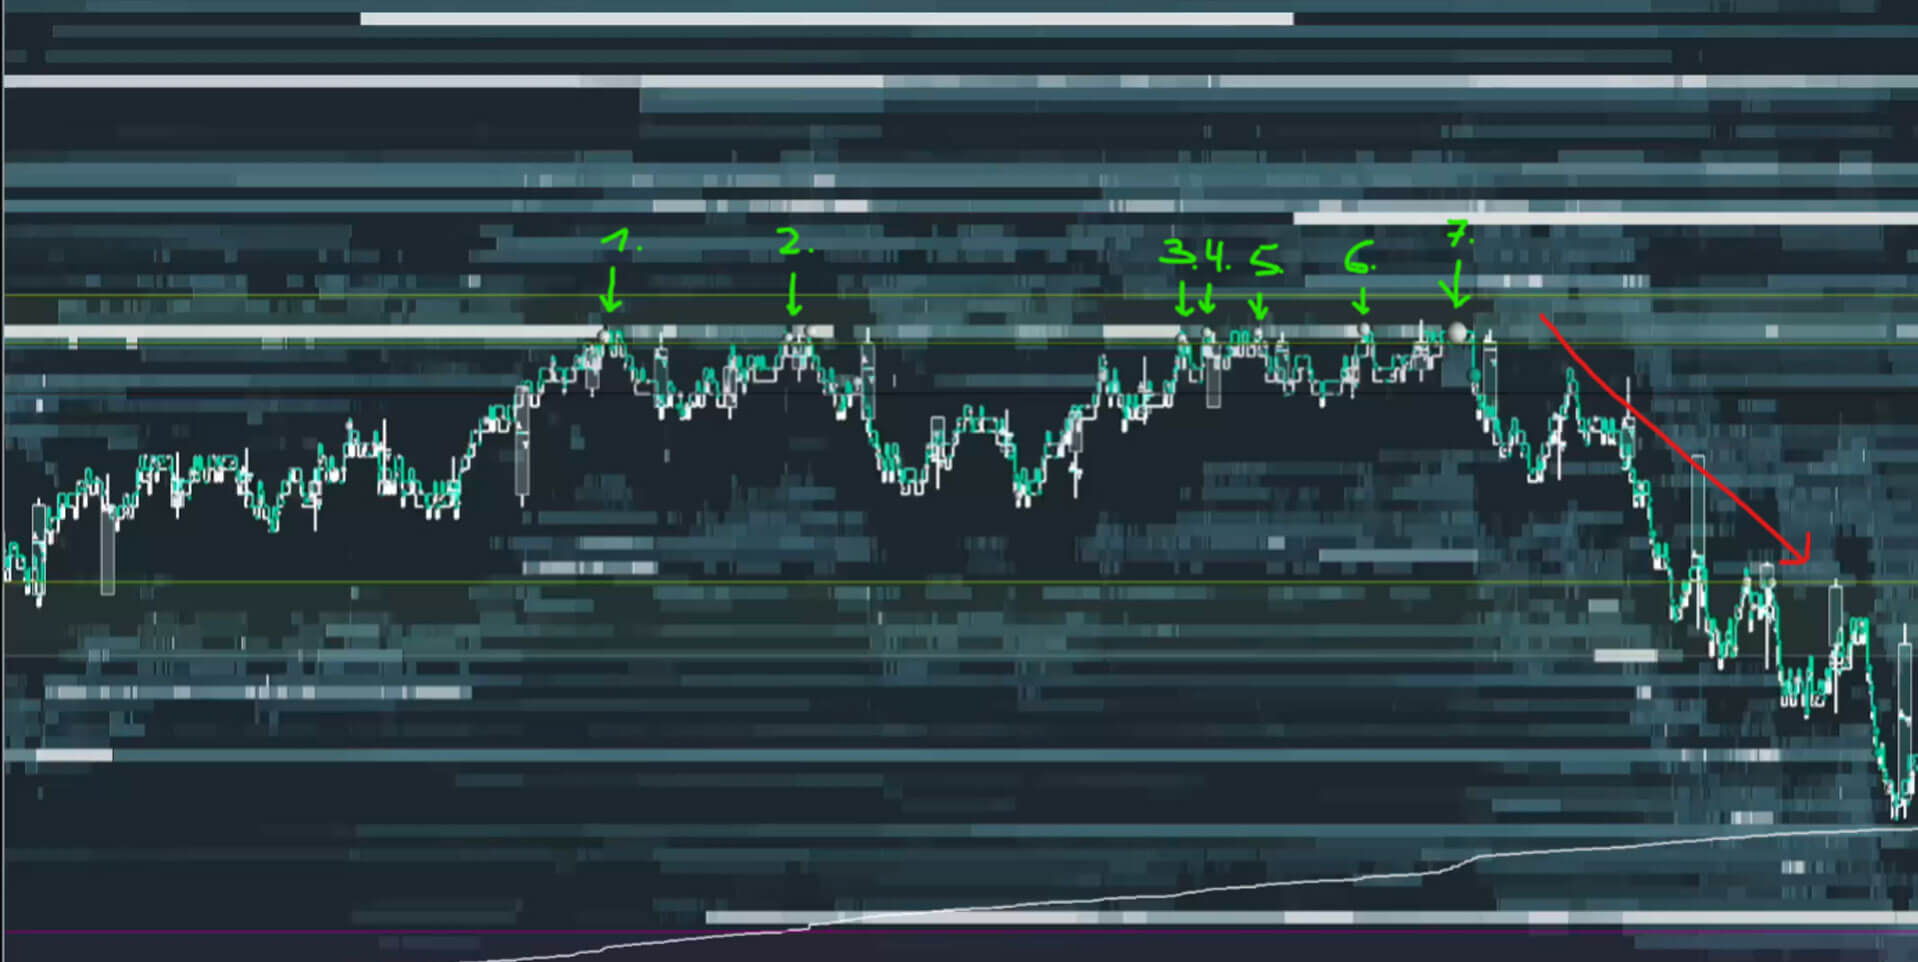
Here, three levels sat at one price: the settlement price, the previous day's low and a dark pool level. Such a coincidence counts as a level with triple confirmation. The market bounced off it twice. The second time, the heatmap first showed a stop runPrice moves through a zone where many stop orders sit and triggers them. below the level before price broke out to the upside. “I love levels with triple confirmation. There is nothing better than when several factors coincide and tell us: there is institutional interest,” says Oliver.

5-minute chart of the S&P 500 future with volume profile: price falls back to the same price area twice and then rises.
S&P 500 future (ES): the market comes back to the level twice before breaking out to the upside. Still from the webinar, minute 49. Image: ATAS Deutschland

A level that reacts does not make a trade by itself. “Not just placing a limit order somehow and a stop five ticks below, that will not work, but always working with clear, repeatable setups,” says Oliver Sparing.

06

What you can take away from the webinar

  • A level is a place, not a trade. Before the session, you decide in your market analysis where you will look for long or short trades. At the level, the order book then decides.
  • Levels also help with waiting. If the next resistance is only a few ticks away, it can be worth waiting for the breakout so the trade has more room in your direction. If many levels sit close together, it can make sense to skip the area altogether.
  • No blanket limit orders at levels. The market can run through a level by a few ticks and still react to it.
  • A setup has to be repeatable. What matters is a pattern you recognize clearly and evaluate statistically with your trading journal.

“None of this is the holy grail of trading.”

Oliver Sparing on dark pool levels and dealer hedging data (translated from the German webinar)
07

About the webinar

The webinar ran on October 30, 2025 as part of the webinar series on the YouTube channel of ATAS Deutschland, hosted by Pavel from ATAS. It is held in German; on YouTube, you can switch on automatically translated subtitles. ATAS is a trading platform for order flow analysis. Oliver is a regular guest there; you can find all appearances on our guest appearances page.

Free Plan · Dark Pool Profile
Where did trading happen off the exchange?
The Dark Pool Profile shows you the aggregated dark pool volume of the last two US trading days over the 5-minute chart of the latest session. It is part of TradeNeon's Free Plan.
Start Free Plan
Frequently asked questions
Are dark pools legal?

Yes. Dark pools are regulated trading venues, usually operated by large banks or fund companies. Every trade executed there is reported to the authorities, although with a delay.

Can I trade in dark pools as a retail trader?

No, retail traders have no direct access. You can, however, analyze the reported trades once they are published.

Does a dark pool print show whether it was a buy or a sell?

No. A print shows price and volume. Who took the initiative and what intent lies behind it remains open. That is why context matters: how did the market move afterwards, and what does the order book show when price comes back to the level?

Which timeframe suits the heatmap?

For the heatmap and microstructure, a very short timeframe is the usual choice, such as a 5-second chart. A 5-minute chart is common for the course of the day, and an hourly or 4-hour chart for the bigger picture. Between comparable timeframes, such as 1 minute or 5 minutes, the picture usually changes only slightly.

Oliver Sparing
Oliver Sparing
Founder & Head of Trading · TradeNeon
Oliver Sparing has been actively trading the financial markets since 2011. His professional roots lie in precious metals trading in Hamburg; in 2017 he learned at a London trading floor. At TradeNeon he leads the day trading and swing trading programmes and is responsible for the trading methodology, with a focus on order flow, market structure and fundamental market data. Level of Interest, Futures Insights and Lab of Trades grew out of this work. Platforms such as ATAS, Bookmap and WH SelfInvest regularly invite him as a guest. All guest appearances

Position Sizing and Risk Management in Trading

Position Sizing and Risk Management in Trading

Metal balance scale on a trading desk, with contract weights on one pan and a red risk weight on the other
Trading Practical guide

It's not the entry — it's the position size

What do you think of first when you consider what makes trading successful? Most people name the perfect entry, the right stop or a price target. One factor is almost always overlooked — even though it determines whether an account grows or shrinks over the years.

The position size on one side, the risk limit on the other.Image: TradeNeon

Position size determines how much capital you put at risk on each trade and how strongly a price move affects your account. That makes it central to risk management. If you ignore it or calculate it incorrectly, you expose your account to avoidable swings.

Let us look at how to calculate it, what else applies when trading through a prop firm, and which mistakes you can avoid. By the end, you will have a method you can apply in a few seconds before each trade.

1 %
Reference risk per trade — kept consistent across trades
2 contracts
The result with $100 of risk and a 10-point stop in a Micro E-mini future
1,000 USD
Illustrative loss limit for an account advertised as $25,000
The point

Position size is the only factor in a trade that you control completely. You cannot control the market, and you have only limited control over your entry — but you decide in advance how much a single trade may cost you.

01

The formula and its inputs

The calculation is not complicated. It fits on one line:

Number of contracts = (account balance × risk percentage) ÷ (stop distance × point value per contract)

You need four inputs before you place an order:

  • Account balance — your current balance, not an earlier peak.
  • Risk percentage — the share of capital you are willing to risk on one trade.
  • Stop distance — the distance between entry and stop, measured in points, ticksA tick is the smallest possible change that the price of a future can make. The E-mini future on the S&P 500 index with the ticker symbol ES, for example, has a tick size of 0.25. In this case, 4 ticks would be 1 point. or pipsA pip is the smallest common price change of a currency pair in forex trading. For most pairs, that is the fourth decimal place. It is the unit used to measure your stop distance in that market..
  • Point or pip value per contract or lot — the cash value of one unit of stop distance. Both values must use the same unit.
Example

With a $10,000 account and 1% risk, you risk $100 per trade. This risk per trade is the most important figure in your risk management: keeping it consistent prevents individual outliers from throwing your performance out of balance.

What percentage is appropriate?

Our reference point is 1% per trade. Someone starting out may feel more comfortable with 0.5%, which allows more unsuccessful attempts before losses become uncomfortable. Staying well above 2% is hard over time because even an ordinary losing streak can take a noticeable toll on the account.

Consistency matters more than the exact figure. A percentage you apply across hundreds of trades is more useful than one you change according to your mood.

02

From stop distance to contract count

How many contracts does that give you? You now need the stop distance. There are two ways to set it.

Option A
Fixed stop
Always use the same distance, such as 10 points. It is easy to calculate but inflexible — the market does not adjust to your preferred number. We do not recommend it as a permanent approach.
Option B
Dynamic stop
Based on support and resistance zonesSupport and resistance are price areas where a move has repeatedly stopped or reversed in the past. A support lies below the current price, a resistance above it. In practice they are rarely exact lines, more like zones — a stop belongs beyond such a zone, not in the middle of it. and current volatility. This can fit the market better, but calls for experience and a new calculation on each trade.
Fixed stop loss: a horizontal red stop line beneath candlesticks on a dark trading monitor
Fixed stop. The same distance regardless of current market conditions.
Dynamic stop loss: a red line rising in steps beneath successive higher price lows on a trading monitor
Dynamic stop. Derived from price action and recalculated for each trade.

For illustration, keep the fixed stop at 10 points. With the $100 risk budget above, that gives:

$100 ÷ 10 points = $10 risk per point Your contract count must fit within this amount.

A futures example

The E-mini futureA future is a standardised contract that obliges its parties to transact in the future. Futures have an expiry date and are derivatives; underlying markets include equities, indices and commodities. on the S&P 500 (ES) moves $50 per index point. With a $10,000 account and a 10-point stop, one ES contract would risk $500, far above the $100 target. The Micro E-mini (MES) is one tenth of that size, at $5 per point.

With $10 of risk per point and $5 per point for each MES, $10 ÷ $5 gives 2 MES contracts. That completes the calculation: balance, risk limit, stop distance and contract point value lead to the number of contracts.

For ES and MES, try your figures in the position size calculator. Enter the stop distance in ticks; four ES or MES ticks equal one index point.

With dynamic stops, you repeat this calculation for every trade. It sounds more involved than it is: once you know your market’s tick size and tick value, it takes seconds. The same principle applies in other markets. In forexForex stands for “Foreign Exchange”; it refers to interbank trading. On the Forex markets, currencies are traded. Trading does not take place via the stock exchange, but directly between banks and brokers. trading, the pip value takes the place of the tick value, and the contract count becomes a position size in lotsThe lot is the trading unit in forex trading — it indicates how many units of the base currency a position covers. A standard lot corresponds to 100,000 units, a mini lot to 10,000, and a micro lot to 1,000..

03

Prop trading: the usable loss limit

When you trade your own money, you can apply the formula to your account balance. With a provider of trading capital — a prop firmIn prop trading, you do not trade with your own money but with the capital of a provider — a so-called prop firm. Usually, you first prove your trading ability in an evaluation phase and then receive an account whose profits are shared between you and the provider. What matters are the rules of the respective provider: a maximum total loss and often a daily loss limit. — additional rules change your calculation. Many providers, for example, set a maximum daily loss. Where that applies, choose your position size more defensively so that one bad day does not end your participation in the programme.

When comparing providers, check their current contract terms, loss limits and regulatory status yourself. Our 2024 comparison is historical context, not a current provider recommendation.

The trap in the account name

A hypothetical example shows the difference: a programme advertised as a $25,000 account might allow a maximum loss of $1,000, while a $50,000 programme might allow $1,500. These are illustrative figures, not current provider terms. Your risk budget depends on the actual loss limit, daily cap and calculation rules. Reaching a limit ends participation in many programmes.

Large metal account frame holding a small red loss buffer on a trading desk, illustrating prop-account limits
Two figures per account. The advertised account size and the permitted loss limit are different.

The practical lesson: For sizing risk, the available loss limit matters more than the figure in the account name. Using $25,000 or $50,000 as the risk base can lead you to breach the programme limits quickly.

Reality check: how much can you risk?

Take the hypothetical $25,000 account with a $1,000 maximum loss. One percent of the advertised $25,000 would be $250 per trade. Four full losses would consume the assumed $1,000 limit; fees and additional rules could make that happen sooner.

That may be acceptable in a prop-firm evaluation. You should not develop the same risk-management habit with your own money: over a handful of trades, performance fluctuates too much to draw a useful conclusion from it.

Rule of thumb

Size your prop-firm risk budget against the loss limit actually available and check daily caps and fees. In the hypothetical example, 1% of a $1,000 maximum loss is $10 per trade.

With a $10 budget and one MES contract worth $5 per index point, the arithmetic allows a stop of only two points before fees or slippage. If a market-based stop does not fit that budget, the position is too large for this trade. Do not raise your risk limit just to force the trade. We also looked at the gap between expectations and arithmetic in Can trading make you rich? (German-language Academy article) .

04

Three risk-management mistakes

The calculation is straightforward, yet in practice traders keep stumbling over the same three points. They also feature among the classics in our collection of common trading mistakes .

Mistake 1: a fixed contract count instead of adjusting to risk

Many traders keep using the same contract count regardless of the size of the account or the distance to the stop. As a result, some trades risk disproportionately much, while others barely affect the account.

How to avoid it: Recalculate position size for each trade. Start with your stop distance, not a favourite number of contracts.

Whole contracts cannot be divided indefinitely. If the smallest tradeable size exceeds the risk limit you set, skip the trade or use a smaller instrument. Your limit is a ceiling, not a target to exceed.

Mistake 2: moving the stop to fit your desired size

Instead of setting a stop that suits current volatility and support and resistance zones, a trader may place it artificially close to the entry so that the desired contract count still fits the risk percentage.

That is a sign that the position is too large. Normal price movement can then trigger the stop and undermine the purpose of the risk plan.

How to avoid it: Set a market-based stop first, then adjust position size. Never reverse that order.

Mistake 3: increasing size after a winning streak

After several wins, it can feel natural to increase size aggressively. A normal losing streak can then give back much of the earlier gain.

How to avoid it: Keep the risk rule consistent. Reassess it when the account balance has changed sustainably, not because of excitement after a few good trades.

Position size is no theoretical detail; it is one of the most important parts of stable risk management. Applying it consistently helps keep individual trades from destabilising your account — and gives you the chance to stay in trading long enough to improve.

Take the time to calculate your position size deliberately before every trade. With practice, it becomes a task of a few seconds that can spare you a great deal of uncertainty over the years.

Glad you are here.

Frequently asked questions
Why does position size matter in trading?

Because it directly determines how much capital you risk on each trade. Even with a good strategy, an account can quickly move into loss without a careful calculation. Position size is the foundation of stable risk management.

How much of my account should I risk per trade?

One percent of the account balance is a useful reference point. Someone starting out may feel more comfortable with 0.5%; staying well above 2% is hard over time. More important than the exact number is applying it consistently.

How do I calculate position size for futures and forex?

Divide your cash risk budget by stop distance multiplied by the cash value of each point, tick or pip per contract or lot. Keep the distance and value in matching units.

Do I need to recalculate for each trade?

Yes, whenever the stop distance changes. You also need to recalculate when the account balance has changed sustainably. Only then does your planned risk stay consistent across trades.

What changes when trading through a prop firm?

Use the loss limit actually available, not the account size in the programme name, and check daily caps and drawdown rules.

Should I increase size after a winning streak?

Not in the short term. Adjust the size only when your account balance has changed sustainably. Increasing it in the excitement after a few good trades can give those gains back in the next losing streak.

The calculation is the easy part
A formula cannot replace a coherent approach. In our training programmes, you build risk management, market understanding and strategy so that they fit together — and suit your trading style and everyday life. These programmes are currently offered in German.
Oliver Sparing
Oliver Sparing
Founder & Head of Trading · TradeNeon
Oliver Sparing has been actively trading the financial markets since 2011. His professional roots lie in precious metals trading in Hamburg; in 2017 he learned at a London trading floor. At TradeNeon he leads the day trading and swing trading programmes and is responsible for the trading methodology, with a focus on order flow, market structure and fundamental market data. Level of Interest, Futures Insights and Lab of Trades grew out of this work. Platforms such as ATAS, Bookmap and WH SelfInvest regularly invite him as a guest. All guest appearances
Backtesting in Day Trading: Testing a Trading Idea with Data

Backtesting in Day Trading: Testing a Trading Idea with Data

An old film viewer on an editing table, with strips of film laid out in even rows in front of it and blank index cards and film cans beside it.
VideoATAS webinar

Backtesting in Day Trading:
Testing a Trading Idea
with Data

If you trade discretionarily, you make the decision yourself in the moment, and even so, the trading idea behind it needs a foundation of data. A backtest for discretionary day traders has two steps: first a statistical test with fixed rules in replay, then the discretionary execution. Here the process is walked through using the S&P 500 future in the ATAS replay.

The same idea, played through again and again and filed neatly. Only the quantity makes a statement possible.Image: TradeNeon

Key points first

A statistical backtest comes before discretionary trading: with clear rules that leave no room for interpretation, trades are collected in replay and recorded in a table with entry, result, maximum open profit and maximum open loss. After about 30 to 50 trades, a first feel emerges for whether the idea is heading in the right direction; 300 trades count as a “golden amount” for a first statistical statement, a value from experience rather than proof of a lasting edge. The table gives indications of where stops and position size might need adjusting, and the example shown is explicitly not a finished trading system.

01

The video

Playing the video connects to YouTube. Watch on YouTube

Chapters in the video 17

Click a timestamp to start the video at that point.

Video: ATAS DeutschlandMore videos from TradeNeon on our YouTube channel.

02

Why a statistical backtest comes first

There are two kinds of backtests. The statistical backtest comes first, even if you intend to trade discretionarily later. It answers a preliminary question: is the basic idea your trading system is meant to rest on heading in the right direction at all, and can an edgeA recurring advantage in the market that holds up over many trades and after costs and does not rest on chance. A backtest offers indications of it, not proof. be developed from it?

This calls for fixed rules. Unlike later in discretionary trading, they must leave no room for interpretation: if the market does this and this, it is an entry. If it does that and that, it is an exit, whether a stop, a certain market move or a span of time. The decisions in discretionary trading should still rest on market logic and a repeatable core idea later on. In the end, it always comes down to pattern recognition: you need something you can recognize and repeat.

03

Market analysis as the foundation of the trading idea

Before any backtest comes the question of where you want to trade in the first place. It starts with a market analysis: at which prices does institutional trading interest sit? Which factors do you include, such as volume profile, market profile, the footprint chartA chart that shows, inside each candle, how much was bought and sold at which prices., VWAP, dealer hedging data or dark pool data? Oliver Sparing works with his own levels from this analysis, available as the software Level of Interest. They are the basis for every system he develops.

When the market reaches one of these levels, it is already settled whether a trade is considered there and in which direction. Then a specific pattern is needed that has to be visible before buying or selling. Which data you use is your decision. “I personally consider level 2 data the biggest advantage you can have as a retail day trader, and I would not want to miss that data. But I am the last person to say that trading is not possible without level 2 data,” says Oliver Sparing, who trades the order book himself.

04

Using the replay properly

To collect the data, the replayThe playback of past market data in ATAS, which lets you practice and test as in live trading. function in ATAS is a good fit. “The replay function is your most powerful tool, especially when you are at the start of your trading career,” says Oliver Sparing. As of May 2025, the replay data, including order book data, came directly from ATAS. To practice and learn, you therefore did not need a paid live data feed from the beginning. Level 2 data is needed for the heatmapThe heatmap shows the order book over time: where limit orders sat and how large they were. in real-time use. ATAS now offers several replay modes with different data depth, and real-time data and replay are two different things. Which data your replay contains today, you are best off checking directly with ATAS.

Two warnings apply to the replay. First, speed: anyone who tests the strategy at a hundred times the speed takes the psychology out of trading, and psychology is exactly what often causes the biggest problems later. At points where a trade could come up, five times speed at most is advisable, preferably two times or real time. In fast-forward, sitting out a sideways phase costs no effort. In real time, the same phase drags on for twenty minutes and tests your patience.

Second, trading hours: you do not sit at the market twenty-four hours a day. So backtest only the time window in which you can actually trade in everyday life. Even if you see a good opportunity shortly before or after, it does not belong in the statistics, because in real time you would probably not have traded it.

05

The example idea: structure at a level

As an example, take a day in the S&P 500 future when the market sits in a bear zone, an area from the Level of Interest analysis. Bear zones and bull zones serve as part of the daily orientation and as a filter: in bear zones the focus is mainly on short trades, in bull zones mainly on long trades. Oliver Sparing trades this way in about 90 percent of his trades. There are exceptions, which are not covered here.

5-minute chart of the S&P 500 future on May 22, 2025 with a bear zone shaded in red. Overnight the price moves sideways between a purple-pink line and a volume profile level at 5,876, drops sharply shortly before the open down to the lower edge of the bear zone and bounces up from there.
The trading day on the 5-minute chart: the bear zone (shaded red) comes from the Level of Interest analysis and is derived from dealer hedging data. From minute 21:20. Image: ATAS Deutschland

The day unfolds like this: in the Asian and European sessions, the market moves sideways between the previous day's settlement price and a volume profile level at 5,876. Shortly before the open, it sells off sharply, runs down to the lower edge of the bear zone and bounces up from there almost exactly.

The rule for the test is kept deliberately plain. On the 5-second chart, the market runs into a level and forms a small structure. As soon as it makes a lower low, meaning it undercuts the last low, the test opens a short trade. In the bull zone, the reverse applies for long trades. The stop sits above the last high. If the trade moves in the desired direction, the stop is trailed above the last high with every new lower low. The trade ends when the market breaks that high to the upside.

An important point: this is not a finished trading system and not a recommendation to trade it this way. It is a coherent core idea from which a system can be developed. Money and risk management and position size play no role yet in the first, purely statistical pass. The calculation is done without slippage, and for the stop, the first aim is to find out in which range it should sit for this idea.

06

The evaluation table

The data belongs in a plain table. A professional trading journal looks different, as we show in our article How to Keep a Trading Journal. For a statistical backtest, five values are enough.

  • Date and time You record when the trade took place, in the example in New York time.
  • Direction You note whether the trade was long or short.
  • Result in ticks The result is recorded in ticksThe smallest price step of a futures contract. The result of a trade is often measured in ticks., even if the trade was stopped out.
  • Maximum open profit This is how far the trade moved in your direction before it ended.
  • Maximum open loss This is how far the trade moved against you after entry. This value is especially important.

The entry and exit price should also be noted. Partial profits that you take later in discretionary trading are entered separately in the table.

07

Two examples in replay

In the replay, two trades play out following this logic, both on the same trading day (May 22, 2025), the second at the previous day's settlement price and further levels. In the first case, the trade ends after a short time at the trailed stop, although in the course of it, it had been well further in profit. In the second case, the market runs through several levels in the desired direction, the stop is trailed several times, and the trade only ends at the trailed stop.

TradeResultMax. open profitMax. open loss
Trade 1 · 9:15 a.m. NY · short+1 tick+29 ticks−2 ticks
Trade 2 · 10:10 a.m. NY · short+63 ticks+121 ticks−4 ticks

These are two illustrative examples from the replay of May 22, 2025, calculated without slippage and costs. They are no proof of performance of the idea or of any strategy. The first trade shows how far the course of a trade and its result can lie apart: at one point it stood 29 ticks in open profit and ended at one tick. A stop of three ticks would have been enough to stay in the trade, because such a small open loss is rather unusual at this point.

5-second chart of the S&P 500 future with an order book heatmap in replay. A measuring box shaded in red spans from the entry to the exit at the trailed stop, and its label shows 63 ticks (15.75 points).
The second trade in replay: the measuring box runs from the entry to the exit at the trailed stop and shows 63 ticks (15.75 points). From minute 45:40. Image: ATAS Deutschland

Here the difference between replay and practice becomes visible. In accelerated replay, everything feels comfortable. In a real trade that is well in profit, your finger would probably often itch to take profits. “That ‘this is enough for me now’ is the end of every profitable trading system. If you take profits on a gut feeling, that is never good,” says Oliver Sparing. The statistical test, by contrast, deals with a purely mechanical idea that shows what the market actually offers in relation to the trading idea.

08

Evaluating many trades: 300 as a figure from experience

A sensible assignment is to evaluate at least 300 such trades. That is a lot of work, but it gives you a good feel for the market. The numbers are values from experience, not universal thresholds. After about 30 to 50 trades, a first feel emerges for whether the idea is heading in the right direction. If it turns out that there are almost only big losers and hardly any winners, the idea probably has no potential. If it is heading in the right direction, it is worth continuing. “300 trades are always a kind of golden amount, where you can really make a statistical statement about whether a system has potential,” says Oliver Sparing. That is not proof of a viable edge, and a historical test does not predict future results.

Even though it is tedious in practice, anyone who keeps the table up to date every day and has evaluated 300 trades usually knows the market much better and can make clearer decisions later.

09

What the statistics reveal about stops and position size

The table reveals a fair amount. Two examples: If it turns out that, on average, the trades run much further into open profit than what is left in the end, you are probably giving back too much profit. In discretionary trading, you then need to work on your stop placement, without taking away the room the trade needs and damaging the hit rate.

If, conversely, it turns out that winning trades rarely move far against you after entry, a much tighter stop would be conceivable. It might worsen the hit rate somewhat but sharply reduce the loss per trade. At the same time, position size could be scaled up. Evaluating the maximum values makes these relationships visible. The table gives indications here, for example for a tighter stop or a larger position size, but not yet proof that this adjustment works after costs and under other market conditions. Only the further test, the discretionary pass in the next section, shows that.

One more tip from practice: markets change, and a stop that is normal today can be too large or too small in half a year because volatility has changed. So do not shy away from larger stops if the market phase calls for them. With micro futuresSmaller versions of common futures with a fraction of the contract value, which allow position size to be adjusted more finely., you can reduce position size so that your risk per trade stays the same. How the risk per trade fits your account size, you work out with the contract's tick value: stop in ticks times tick value gives the risk per contract. In day trading, Oliver Sparing goes by 0.5 percent risk per trade; one percent is already too aggressive for him.

10

From the statistical to the discretionary backtest

If the first pass has shown that the idea has potential, the second part follows. You now trade the rules discretionarily and keep filling in the table, this time with the actual values: where would you have taken partial profits, where closed the rest of the position, how did the trade run under your management? On the basis of your stop, you choose the position size that fits your risk and enter the results. In the end, you see how the system performed under discretionary management.

In his own trading and in the day trading programme, far more factors interact: the order book, liquidity and its shifts, limit orders that come in or are pulled, the delta, the behavior of active market participants, price action, order flow events as well as market speed and auction speed. The example here is the core idea through which the process can be shown.

11

What you can take away from the webinar

  • Statistical first, then discretionary. Fixed rules with no room for interpretation show whether your idea is heading in the right direction at all.
  • The replay takes discipline. Test at a speed close to real time, and only in the time window in which you can actually trade.
  • Maximum open profit and open loss belong in the table. They give indications of where you give profits back and how tight a stop could be.
  • The amount of data counts. Around 300 evaluated trades are a figure from experience for a first statement about an idea's potential, not proof of an edge. Along the way, you get to know the market.

“Anyone who does not collect data will struggle to become profitable in the long run.”

Oliver Sparing on the statistical backtest (translated from German)
12

About the webinar

The webinar ran on May 29, 2025 on the YouTube channel of ATAS Deutschland and was hosted by ATAS. It is held in German; on YouTube, you can switch on machine-translated subtitles. ATAS is a trading platform for order flow analysis. Oliver is a regular guest there; you can find all appearances on our guest appearances page.

Day trading programme
How do you develop your own system?
In our day trading programme, you work on analysis, entries and risk management as one connected approach that fits your time and your temperament. The programme is currently offered in German.
Day trading programme (German)
Frequently asked questions
Why does a discretionary trader need a statistical backtest?

It shows whether your core idea is heading in the right direction at all and whether an edge can be developed from it. That only works with fixed rules that leave no room for interpretation. The discretionary execution follows afterwards.

How many trades should a backtest include?

There is no fixed number. Values from experience: after about 30 to 50 trades, a first feel emerges for whether the idea is heading in the right direction, and 300 trades count as a “golden amount” for a first statistical statement about the potential. These are not universal thresholds and no proof of a viable edge, and a historical test does not predict future results.

Which values belong in the evaluation table?

Date, time, direction, the result in ticks, the maximum open profit and the maximum open loss after entry. The entry and exit price should also be noted.

What should I watch for in the replay?

Choose the speed carefully: at points where a trade could come up, five times at most, preferably two times or real time, so that you keep a feel for the actual market speed. Also test only the time window in which you can actually trade in everyday life.

Oliver Sparing
Oliver Sparing
Founder & Head of Trading · TradeNeon
Oliver Sparing has been actively trading the financial markets since 2011. His professional roots lie in precious metals trading in Hamburg; in 2017 he learned at a London trading floor. At TradeNeon he leads the day trading and swing trading programmes and is responsible for the trading methodology, with a focus on order flow, market structure and fundamental market data. Level of Interest, Futures Insights and Lab of Trades grew out of this work. Platforms such as ATAS, Bookmap and WH SelfInvest regularly invite him as a guest. All guest appearances

Order Flow in Trading: Understanding Market Moves

Order Flow in Trading: Understanding Market Moves

Anonymous figure with a glass grid head between streams of blue and violet glass beads.
Day tradingMarket mechanics

Order flow in trading:
Understanding market moves

A price chart shows where trading occurred. Order-flow data adds a view of the orders displayed in the book and the trades actually executed. At a price level you identified beforehand, this can help you assess the reaction. It cannot reveal an individual trader's intent.

Displayed orders and executed trades are two different data streams.Image: TradeNeon

Imagine standing beside a river. You can see the water at the surface, sometimes calm, sometimes rushing, while the currents underneath stay out of sight. You may know a similar moment in the market: your setup looks sound, price is about to break out of a range, you enter – and it turns back.

The chart shows where trading took place. An order-flow viewOrder flow concerns changing orders and executions. It shows market activity, but not an individual trader's motives. adds which orders were displayed in the book and which trades actually executed. This can help you examine what happened at a level you selected beforehand. It cannot reveal why a particular trader acted or where price must go next.

After a failed breakout, you may first look to candles, lines or indicators for an explanation. That is where the reversal is visible. To examine how trading unfolded at the range boundary, you need a closer look at executions and the displayed order book. Even those data do not provide a complete story. They add to the chart observation and may challenge a hasty explanation.

The idea behind this article

Market analysis provides the where: a price area where you expect a response. Order flow adds the what: displayed orders, executed volume and price reaction. Together, these observations give context to your decision.

01

What order flow shows – and what it does not

A chart compresses past trades into candles or lines. You see the outcome of a move, but only part of the process. Order-flow tools let you look more closely at what was displayed at individual price levels and what really traded there. In exchange-traded futuresStandardised contracts with a defined underlying market, contract size and expiry., for example, these two kinds of data can be viewed side by side.

Before execution

Displayed limit orders

The order book shows offered buy and sell quantities. They can be added, changed or cancelled. They are not yet traded contracts.

After execution

Actual trades

Executions show where volume changed hands. Price and volume alone identify neither the participants nor their intentions.

A chart and an order-flow view answer different questions. The latter may show whether aggressive buys or sells occurred at a level, whether a lot traded in a narrow area and whether price then progressed. It cannot establish “genuine interest” or a particular hidden intention with certainty. A large displayed order may never execute.

Three questions help with this assessment: Are buyers or sellers entering aggressively? Does price stall despite those executions, or does it progress? And how does the displayed supply on the other side change? Heavy buying does not automatically mean rising prices. Every executed buy has a seller; the amount of liquidity available or replenished on that side also matters.

That is why order flow is no holy grail. Think of it as the screws and nails in a toolbox: useful alongside a plan, market analysis and risk rules. Without a connection to your trading idea, you will find conspicuous patterns everywhere. A brief volume spike or absorption in the middle of a move may simply be market noise.

CME explains how orders, changes and executions update the electronic order book. What depth you can actually see depends on the market, data feed and tool.

02

Why the “what” needs a “where”

Even if you can see what is trading now, a second question remains: where is it happening? For a trading idea aimed at a move lasting more than a few seconds, an arbitrary spike in delta or volume is not enough. You need a defensible area on the chart where a reaction would matter to your thesis.

Mark a support or resistance area, or the edge of a range, before price reaches it. Ask what response you expect and what would challenge your idea. When the market arrives, watch how displayed liquidity, actual trading volume and price progress relate to one another. Strong execution without further progress tells a different story from a breakout that trades through additional levels.

Do not chase every very short-term move. The smaller the time window, the less time you have to check an observation. Before price reaches your area, decide which data and timeframe you will use. A signal without context can tempt you to invent a story only after placing the trade.

1Mark a level

Why does this price area matter to your market analysis?

2Observe the reaction

What happens to executions, displayed depth and price?

3Look for another explanation

Could thin liquidity or a short impulse explain the observation too?

4Limit your risk

A pattern cannot replace a stop or sensible position sizing.

The “where” and “what” work like two interlocking gears. Market analysis shows where you might want to trade; order flow helps you assess the response there. A level you have marked is never a guarantee that the market will react as expected.

03

Reading the order book and heatmap

The order bookA view of displayed buy and sell orders at individual price levels, also called depth of market., or DOM, shows visible limit ordersOrders with a price limit: a buy may fill at or below the limit, a sell at or above it. Execution is not guaranteed. on the bid and ask sides. It is a snapshot. Orders are constantly placed, changed and cancelled. The displayed quantity is neither volume already traded nor a promise that it will still be there when price arrives.

A heatmap plots those displayed quantities over time as coloured traces. Bright areas generally represent more displayed orders in the particular tool. This helps you see where orders rested for longer, which levels price touched repeatedly and where displayed depth fell before price approached. The colour cannot tell you who traded or why an order disappeared.

A heatmap makes changes easier to follow than the flickering numbers in a DOM. A bright trace may show that a large quantity remained displayed at a level for longer. Repeated touches show how price behaved there. A fading trace shows that displayed depth changed. Only with the actual trades can you interpret these observations cautiously. A level that price did not trade through may reflect replenished orders or a lack of aggressive orders.

Historical Bookmap screenshot showing price, horizontal liquidity traces and volume.
Bookmap screenshot from 2025. Bright traces indicate displayed depth in the data feed used then. Open the image for detail; this is not a current market view. Image: TradeNeon.

In this view, Level of Interest added coloured horizontal lines to the heatmap to mark price areas identified through prior market analysis. Those lines are analysis, not executions or evidence of institutional orders. Level of Interest can point to areas worth another look; you assess the reaction there yourself.

If a bright trace fades, order changes and cancellations are possible explanations, as is the way the feed displays depth. That alone does not prove spoofing. CME cautions against using order-book depth alone to measure liquidity. Consider executions, the spreadThe gap between the best available bid and ask prices in a market. and price response too.

Other views

A volume profile groups executed volume by price level. Delta bars and footprint charts show aggressive buy and sell executions within a candle or at each price level. An order-book imbalance compares displayed buy and sell quantities, so it is different from executed volume. You do not need all these views at once. You do need to know what data each one actually shows.

04

What cumulative delta adds

A heatmap mainly describes what was visibly offered in the book. Order-flow delta instead compares aggressively executed buys and sells: trades at the ask are commonly assigned to the buy side and trades at the bid to the sell side. Cumulative delta sums that difference over a chosen period and is often shown as a line beneath the price chart.

If delta rises while price makes little progress at a level, passive sellers may be absorbing aggressive buys. That is a possible clue to absorption, not proof of a particular trader or an imminent reversal. If price rises without a strong delta impulse, several explanations remain possible, including fewer offers on the other side or changing limit orders. A sharp jump in delta indicates increased aggressive volume, but does not establish a single large order.

Three contrasts are particularly useful: pressure without a breakthrough, rising price without a strong delta impulse and a sudden jump in the delta line. All three are useful observations. A single certain explanation would go too far: rising delta with a stalled price does not prove one particular limit seller. A rise without a delta impulse does not prove “hidden strength”. And a sharp jump can consist of several executions. Compare timing, price response and data quality.

The contrast between price and delta makes this view useful. Compare them over the same period and keep your feed's calculation method in mind. Delta shows executed activity; it does not show all resting orders or identify the market participants.

05

Three order-flow patterns in examples

Absorption: much trading, little price progress

Imagine buyers repeatedly trading aggressively at resistance while price barely advances. One-sided delta, high executed volume in a narrow area and little price progress may appear together. Opposing passive limit orders could be absorbing the buying pressure. Who placed them, and what will happen next, remains unknown.

Historical heatmap chart with several marked tests of an upper price area followed by a decline.
Absorption example from 2025: several approaches to the upper area, followed by a decline. The image alone cannot establish which orders executed or why price later fell. Image: TradeNeon.

A large number in the order book is not enough to identify absorption. Look for the combination of actual executed volume and little price progress in the same area. Passive orders may be replenished, or the aggressive side may be weakening. The historical arrows in the image show where you would look more closely. They do not replace a time sequence of executions or a check of what happened afterwards.

In that historical example, the market fell after several attempts. It illustrates a past sequence, not a rule: absorption can also end without a reversal. At a level marked in advance, it is one piece of evidence to combine with other observations and your risk plan.

Sweep: trading through several price levels

In a sweep, aggressive executions take available liquidity across several price levels. This can cause a rapid price move. The chart shows the move; suitable execution data lets you check which levels actually traded. Thin displayed depth may amplify it. A steep delta move or a screenshot does not reveal whether one large participant was responsible.

Historical heatmap chart with a marked fast price move at a price area.
Marked price move in a screenshot from 2025. The marking highlights an area to examine; execution data is needed to assess a sweep. The trader or traders involved remain unknown. Image: TradeNeon.

The example connects a fast price move with a previously examined microstructure. That connection is the useful lesson. The static picture alone cannot verify whether transactions took several levels in one sweep. Use it to frame questions for the execution data, not as a completed diagnosis. Several participants could also trade aggressively at the same time.

Location matters here too. A fast move halfway through an established run may be noise for your plan. At a level marked beforehand, ask the same questions: what actually traded, how did price respond and what other explanation is possible?

Disappearing orders: an observation, not proof of spoofing

A large displayed quantity may appear close to price and disappear before price reaches it. Legitimate changes or cancellations can explain that. Spoofing, by contrast, involves placing an order with the intent to cancel it before execution and create a false impression. A single heatmap cannot establish that intent.

Historical heatmap chart with marked areas of displayed liquidity along the price path.
Heatmap labelled “spoofing” in a screenshot from 2025. Visible traces and cancellations may justify further investigation; this image does not prove deceptive intent. Image: TradeNeon.

When large orders appear briefly and vanish, start with what you can observe: time, price level, displayed size and whether a trade occurred. Then check whether the pattern repeats and how price responds. Even repetition does not prove deceptive intent. Unreliable displayed depth may matter to your trading decision without accusing another participant of unlawful conduct.

CME describes spoofing in terms of intent when placing an order. Careful language matters in your analysis: you can observe displayed liquidity arriving or disappearing without knowing the motive.

06

Using order flow in your trading routine

That is a lot to take in. A calm sequence helps: first choose your market and a relevant level. Write down what would support your thesis, what would challenge it and when you would stay out. Then observe executions, displayed orders and the price response. A striking colour or number becomes an observation you can test.

Order flow takes practice because one pattern rarely has only one interpretation. Absorption need not end in a reversal; a sweep does not identify a trader; a disappearing order does not prove deception. The question is whether what you observe at a level you selected beforehand fits a sound plan.

Level of Interest helps identify potential price areas for market analysis. It is not an order-flow display and cannot make a trading decision for you. If you want to explore the full process of market analysis, execution and risk management, TradeNeon's day-trading programme is currently available in German.

Which levels deserve a closer look?
Level of Interest helps you find potential price areas for analysis. You assess how the market trades when it reaches them.
Explore Level of Interest
Bull and bear – the TradeNeon characters for Level of Interest
Frequently asked questions
What is order flow in trading?

Order flow concerns a market's changing orders and executions. Depending on your data feed, you may see displayed limit orders, traded volume and how they change over time.

Does order flow tell me why price rises?

It adds observations about market activity. It cannot unambiguously reveal a particular trader's motive or the cause of every price move.

Is a large order in the book always important?

No. It can be changed or cancelled and might never execute. Assess it together with actual trades and the price response.

Can I identify spoofing with certainty in a heatmap?

No. Repeatedly disappearing orders can prompt questions, but a single view cannot establish the deceptive intent required for spoofing.

Simon Reichert
Simon Reichert
Swing trading coach · TradeNeon
Simon Reichert is a swing trading coach at TradeNeon. He studied International Business Management, worked in finance and auditing, and has traded actively since 2022. His focus is swing trading, the broader market context and risk management.
Day Trading with the Order Book: How Prices Move

Day Trading with the Order Book: How Prices Move

A dark building is shown in cross-section, with several open floors and thick ceilings.
VideoWH SelfInvest webinar

Day Trading with the Order Book:
How Prices Move

At first glance, the order book can feel overwhelming, yet it follows a logic you can trace. That logic starts with the question of who moves the price and runs through the heatmap and the DOM, absorption and delta, to the five factors to check before every trade. The order book comes last: market analysis first decides where it is worth looking into it.

To move up, price has to break through the ceiling. The order book shows how thick it is.Image: TradeNeon

Key points first

The order book comes last: first you set the zone you want to trade through your market analysis, and you look at the book when the market arrives there. The heatmap and the DOM are two tools for the same data. What you see in them, absorption for instance, remains an interpretation rather than proof, because anonymous order book data does not show who is trading. Five factors serve as a checklist before every trade: active market participants, passive market participants, market and auction speed, market structure and order flow events.

01

The video

The video is in German. For English audio, open the settings (gear icon) in the player and choose Audio track → English.

Playing the video connects to YouTube. Watch on YouTube

Chapters in the video 20

Click a timestamp to start the video at that point.

Video: WH SelfInvest DeutschlandMore videos from TradeNeon on our YouTube channel.

02

Why the order book needs structure

The order book is on everyone's lips again. Earlier, even retail investors had hardly any insight into the depth of the market; today, they have plenty of information and tools at their disposal. That is exactly what makes the start hard: what is relevant, what is not, what should I focus on?

Host Stefan Fröhlich adds that an approach should be based on logic and be repeatable without becoming too complicated. From support, he knows platforms packed with lines and indicators, where you quickly get lost in the details. The order book itself is less complicated than it looks: once you have understood the concept and the basic idea, you can see the logic behind the hustle and bustle.

03

Market, limit and stop orders

Who actually moves the price? There are two basic order types: with a market orderAn order that is executed immediately at the next available price. It is filled by a limit order., you accept the best available price. A limit orderAn order with a price limit: a maximum price when buying or a minimum price when selling. It waits in the order book until a market order fills it., by contrast, is a bid: a maximum price you pay as a buyer or a minimum price you accept as a seller. On top of that come stop ordersAn order that is triggered as soon as the stop price is reached. A conventional stop order then becomes a market order (not so with stop-limit orders)., which only become active once the stop price is reached.

CriterionMarket orderLimit orderStop order
What you setNothing but the quantity.A maximum price when buying or a minimum price when selling.The stop price.
ExecutionImmediately, at the best available price.Only once a market order fills it, possibly not at all.Once the stop price is reached, the conventional stop order becomes a market order and takes the next available limit price in the book.
In the order bookNot visible, it takes liquidity.Sits visibly in the bid or the ask.Does not sit in the public book until triggered and only appears in trading as a market order after it is triggered.

What matters is how they interact: market orders are always filled by limit orders, and limit orders as a rule by market orders. Whoever buys at market is filled by a limit seller, and whoever sells at market by a limit buyer. Stop-limit orders are deliberately left aside here.

04

Bid and ask

The order book has two sides. The bidThe buy side of the order book: all limit buy orders. contains all limit buy orders, the askThe sell side of the order book: all limit sell orders. Also called offer. all limit sell orders. Bid and ask are never at the same price but at least one tick, one cent or one pip apart. The highest price offered by buyers and the lowest price asked by sellers have to differ because limit orders are not filled by limit orders.

05

The skyscraper image: ceiling and floor

The skyscraper image explains how prices rise or fall: you are a little figure in a skyscraper. If you want to go up one floor, which stands for a rising price, you have to drill through the ceiling. The ceiling is the limit sell orders in the ask. If you want to go down, you drill through the floor, and that consists of the limit buy orders in the bid.

Ceiling and floor can be of different thickness. If there are 100 contracts at the next price of the ask and only 10 in the bid, it takes clearly more market buys to make the price rise than market sells to make it fall. The problem for you as a trader: you never know how thick the ceiling really is. Whoever sits on the floor above can be a large institutional market participant, such as a fund or a large hedger. Anonymous order book data, however, does not let you tell. Whoever it is: while you work your way through the ceiling with your market orders, new limit sell orders can keep being added and thereby patch up the ceiling.

06

Buyers and sellers: active and passive

A common misunderstanding, especially on the topic of deltaThe difference between market buys and market sells at a price.: there can never be more buyers than sellers or the other way round. Every transaction always has two sides. They proceed differently, though. Aggressive buyers and sellers open their orders with market orders; they accept the next best price. Passive market participants place limit orders in the book and wait.

For the price to jump to the next level, the entire limit order quantity at the current price has to be worked through. If an aggressive buyer comes with a larger order, they run through several prices and can make the price rise further. What sits in the book is visible to everyone in a standardized, regulated market such as futures, stocks or options, and everyone sees the same trading volume. What is not visible is whether and how many institutional participants sit in the background and how willing they are to patch up the ceiling again and again. You can work with that if you know what to watch for.

07

Heatmap and DOM: tools, not camps

The webinar puts two visual forms of the order book side by side: the heatmapA historical recording of the order book. The warmer the color, the larger the limit order at the price. on the left, the classic DOMDepth of market, the classic order book. It shows in real time how many limit orders sit at the individual prices. (depth of market) on the right. Camps form quickly in the trading world, team heatmap against team order book or team RSI against team MACD, and everyone considers their own approach the only right one. The advice is to stay neutral: both are tools for data visualization with their own strengths, weaknesses and areas of application.

The DOM basically shows the same data as the heatmap, but in a different way, and you can take different information from it. One does not rule out the other; the two tools complement each other. Everyone has to decide for themselves which they get along with better or whether they use both. That applies to all concepts in trading.

Split screen: on the left the heatmap (Bookmap) of the ES future with price history and brighter lines for larger limit orders and a volume profile along the right edge, on the right the DOM with a blue bid side, a red ask side and the number of contracts at each price.
Visible: on the left the heatmap (Bookmap) of the ES future (December 2024 contract) with price moving around 5,780 to 5,790. Brighter lines stand for larger limit orders, and a volume profile runs along the right edge. On the right the DOM with bid (blue) and ask (red) and the number of contracts at each price. The reading in the webinar: the same data, once as a history over time, once as a snapshot per price. From minute 23:40. Image: WH SelfInvest Deutschland
08

Institutional traders and dark pools

A thought experiment with the skyscraper image shows how large market participants deal with the order book: a trader is supposed to buy 100,000 contracts of the ES future over the course of the day. With a single market order, they would work through the entire book, drive the price up and make their own average price worse. A huge limit order would be visible to everyone, and front-running algos would buy ahead of it.

So they build the position piece by piece, over a day or, with even larger orders, over several weeks, with a mix of market and limit orders or with hidden iceberg ordersHidden limit orders: only part of a large order is visible in the order book.. The fewer other market participants notice them, the better: they want to move the price as little as possible and buy as cheaply as possible.

Side note: what dark pools are

dark poolsAlternative trading venues for securities, above all stocks and ETFs, supervised in the US by the SEC as alternative trading systems. Large market participants trade there largely anonymously and without a public order book. Executed trades are reported, with size and price. are alternative trading venues for securities, above all stocks and ETFs. In the US they are supervised by the SEC as “alternative trading systems”. ES futures are not traded there. In the webinar, the futures example and the dark pools are covered in one train of thought. Here we keep the two apart: the common point is the approach of large market participants to leave as few traces as possible in the public order book. For futures, the CME has its own procedures for large orders, such as block trades.

Dark pools give large trading parties the chance to trade largely anonymously and without a public order book, with as little influence on the price as possible. Off-exchange trading can still affect price discovery, though. Often only part of a large order runs through dark pools, the rest through the official exchange. Executed dark pool trades are reported and show up in the trading data, with size and price but without an indication of whether the buyer or the seller took the initiative.

For traders, that has value: in the normal order book, you never know whether an order comes from an institution or from a larger retail trader. With dark pool data, it is different: “With dark pools, we always know for certain that guys with big wallets are involved,” says Oliver. You can find more about the data in our video article on dark pools.

09

Volume profile and fair price

More important than the dark pools themselves is the approach of institutional traders: they need liquidity and want to trade at prices that buyers and sellers consider fair. The volume profileShows at which prices a lot or little volume was traded within a time span. shows this. It does not show how much volume was traded on which candle but at which prices within a time span a lot or little volume was traded. In the middle of the profile, where a lot of two-sided trading took place, a large market participant quickly finds a counterparty without moving the price much.

The further price rises, the less trading interest there is. In the premium area, the price becomes attractive for sellers, but fewer and fewer buyers still see it as fair. Downward, it is the other way round in the discount area. A basic idea of auction theory: price usually comes back to its fair value in the middle. That is not a general rule; price can also find a new area, for instance when news fundamentally changes the situation. In day trading, there is a second reading: an institutional trader might have built up enough position in the sideways range and wait until the market runs into the premium area. Then they place many market orders into the market, drill through the ask and let the market break out. This is only a look at the surface of auction theory.

10

The DOM

The DOM, short for depth of market, shows you the market depth. For that, you need a level 2 market data feed, meaning a data provider that shows what sits at the individual prices in the market. Such feeds cost money, come from the exchange and are redistributed by various providers. A professional feed is advisable because the providers do differ in quality, and patchy data are no good for this way of trading.

In the DOM, the bid side is blue and the ask side is red. In real time, you see how many contracts sit at a price and how the value changes. That applies to everyone alike, standardized and regulated, which is very advantageous for retail traders. Clusters stand out where clearly more limit orders sit than on average. What you do not know is whether the market arrives there, works through the contracts and the same quantity is added at that very moment. That is absorptionLimit orders are worked through and immediately replenished, so that price does not get through..

11

The heatmap

The heatmap is a historical recording of the order book. It makes it easier to understand what happened there without having to keep an eye on every single price. The warmer the color, the larger the limit order at the price. The big advantage: you see how long an order has already been in the market and how it has developed.

In the example from the webinar, a large order at 5,800 has been sitting there all day and even the day before. Because it has a certain size and has been sitting for so long, there is a lot to suggest that it is real. That is not a sure sign, because an order can be canceled at any time until it is executed.

12

Real and displayed orders

The biggest criticism of the order book is at the same time one of its biggest advantages: you never know in advance whether an order is real. It is possible that someone places an order for 500 contracts in the book to feign trading interest and pulls it out again as soon as the price approaches. As long as an order is not executed, it can be canceled at any time, even by large institutional traders. A visible order still creates interest and influences market participants, even if it disappears later.

Be careful with interpretation: the fact that an order is later canceled does not prove spoofing. Whether there was intent to deceive behind it cannot be read from the order book. Spoofing is prohibited at the CME.

One therefore distinguishes between orders that prove to be real and those that are not. In the example, a large limit order at 5,780 proved to be real: it sat in the market for a very long time, and when price arrived there, many market buyers ran into it, worked through it completely, drilled through the ceiling and rose to the next prices.

13

Absorption and delta in the heatmap

According to theory, price should rise in a balanced order book when more market buys than market sells take place. That is the difference, the delta. In the heatmap, white bubbles stand for market buys and turquoise ones for market sells. In most upward moves, the white ones dominate; in most downward moves, the turquoise ones.

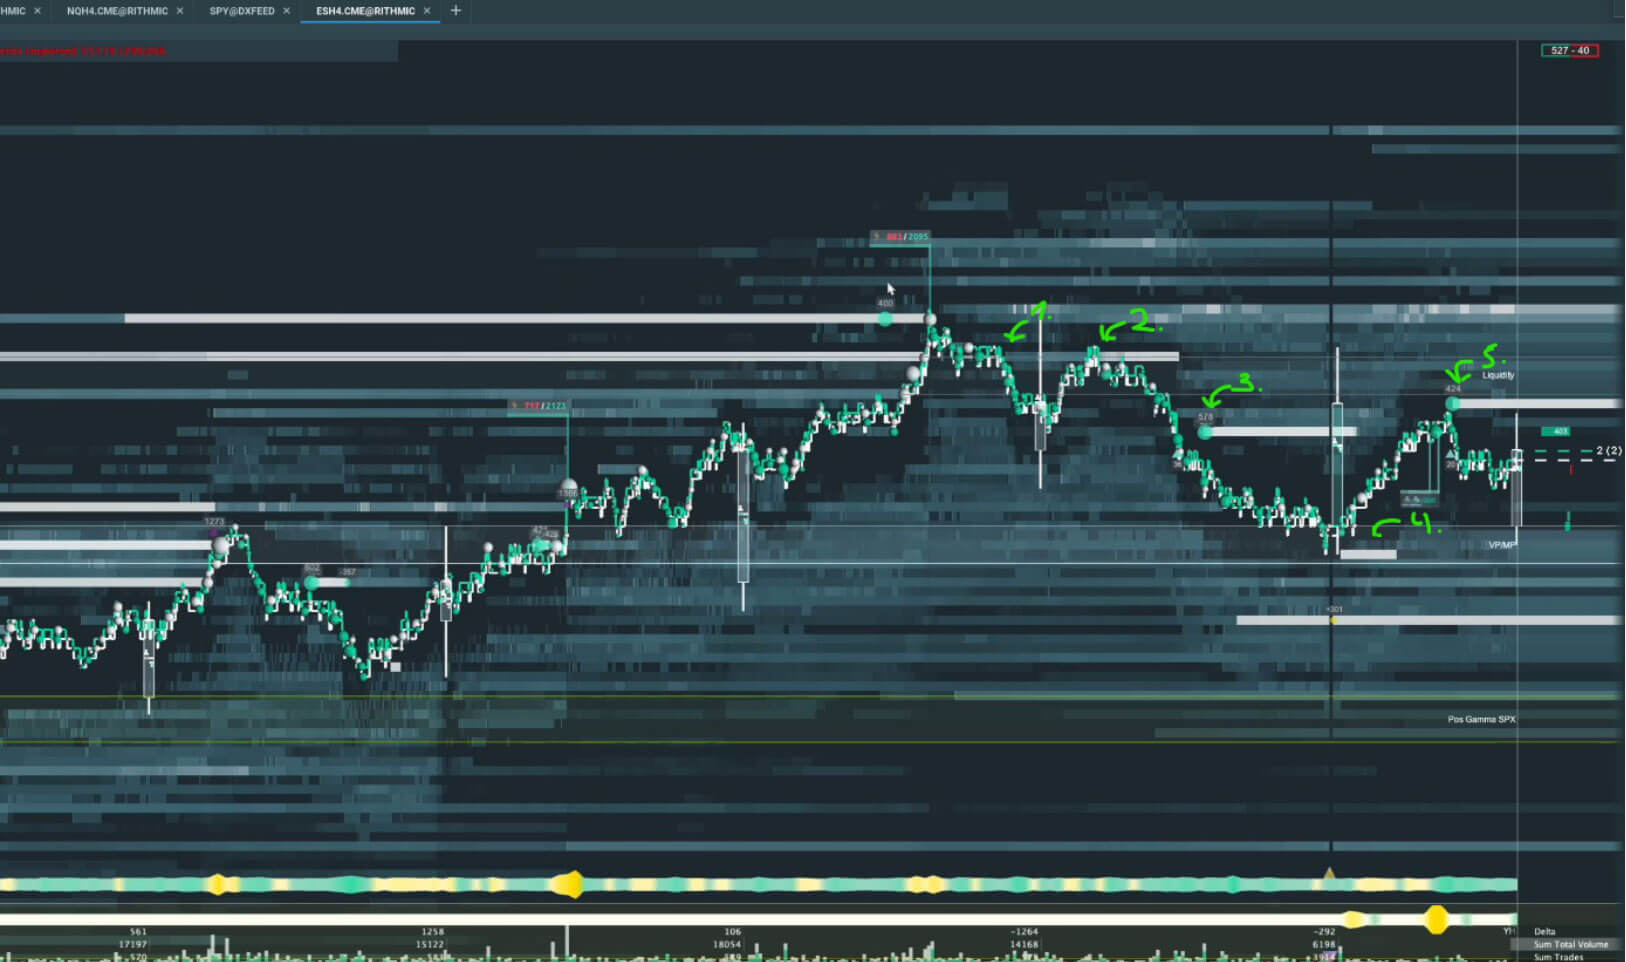
In the example, it goes differently: the market reaches a price area again and again, the white bubbles are clearly larger than the turquoise ones, and still the price tips back every time. One possible reading of the pattern: on the other side sit limit sellers who absorb the market buyers and keep adding new limit orders, like fresh concrete on the ceiling. This happens algorithmically and in milliseconds today but can be traced well afterwards in the heatmap. That is an interpretation of the pattern, not proof of who is trading there. At some point, the question arises which side has the bigger wallet.

Heatmap of the ES future from October 8, 2024: price runs up to the area around 5,790 several times, white and turquoise circles mark market buys and market sells, and at the end price falls to about 5,785.
Visible: heatmap of the ES from October 8, 2024. Price runs up to the area around 5,790 several times, white circles (market buys) are partly larger there than the turquoise ones (market sells), price does not get through and falls to about 5,785 at the end. The reading in the webinar: limit sellers absorb the buys and add more, and at some point the buyers run out of steam. That is an interpretation of the pattern, not proof of who is trading. From minute 51:30. Image: WH SelfInvest Deutschland

If the market buyers are stronger and the sellers can no longer add, a fast sweep up through the book often follows, because many stop orders are triggered along the way. That is a tendency, not a certainty. In the example, the opposite happens, and the interpretation is: the buyers run out of steam, they are fully invested and cannot add anymore. For market sellers, it is then straightforward to push the market through the thin floor. That is called exhaustionOne side runs out of strength, so that the market can run in the opposite direction..

At the beginning, the rule is: do not try to see absorption, an iceberg order or spoofing around every corner. These things happen in the order book all the time. That is why the most important thing is to think before the session about where you want to trade at all.

14

Market analysis first

It starts with market analysis: “Every professional day trader I have met in my career who trades from the order book thinks about market structure before the session,” says Oliver Sparing. The methods differ: dealer hedging levels, gamma and vanna levels, dark pool levels, Fibonacci retracements or classic technical analysis. Here too, many roads lead to Rome. What matters is that you have thought about where institutional trading interest sits and where your best entry opportunities are.

Only when the market comes to such a zone do you look at the order book and watch how the market participants interact there. An example is an uptrend with higher highs and higher lows: the market breaks through an important level, later comes back to this zone, and you want to trade a reversal in the direction of the trend there. That applies on all time frames, although delta on the daily chart does little. That is something for day trading.

15

Delta as a prerequisite for the trade

What you look at first in such zones is the delta. Every trading decision should be supported by active market participants. Active buyers and sellers do not have sole power, because they can be absorbed, but they fundamentally move prices. Whoever wants to go long or short wants active participants on their side before entering.

An example: active sellers push the market down and are filled by limit buyers. Perhaps there is a level where they are absorbed. But as long as no active buyers reappear and show interest, no amount of absorption is enough for an entry: “As long as they are not there, any amount can be absorbed, I would never enter a trade,” says Oliver.

16

Five factors before every trade

Even more important than the active participants is what the passive ones do. That is very extensive and complex. At the end come five factors that are taught in the programme and that you think about before every trade.

  • Active market participants What is the delta doing?
  • Passive market participants How do the limit orders in the book shift? Here the heatmap has the advantage, because it records when orders appear, are pulled or are moved.
  • Market and auction speed Market speed says how fast the market moves from price to price, auction speed how many orders run through the book at what frequency. Here the classic DOM has the advantage.
  • Price action and market structure Where are the prominent highs and lows, on higher time frames as well as in the microstructure?
  • Order flow events Was there absorption, iceberg orders, stop runs, exhaustion or a sweep? Were market participants caught in their stops?

At first, you can go through these points in your head before the trade or even write down what you saw. Order book traders make their trading decision on this basis. All of this is only rough and is meant to give a first impression.

17

Questions from the chat

Do you only see the limit orders in the DOM, or the market orders as well? The answer in the webinar: in principle only the limit orders. Depending on the DOM, you can set it to show in the middle how much was actually traded at the individual prices. The footprint chart goes a step further and shows per candle how many orders were traded at which prices. That is a different topic.

The webinar names no book specifically on the order book: the basics book “Das komplette Börsengrundwissen” is too general for that, and host Stefan Fröhlich does not know of any either. On order book trading, Oliver says: “It is a craft, and I am firmly convinced that anyone can learn it. It is certainly not for everyone, but you should treat it as vocational training. There are really a lot of great people out there who do this well.”

18

What you can take away from the webinar

  • Prices move when market orders work through limit orders. Ceiling and floor are of different thickness, and you never see for sure how much gets added behind them.
  • The heatmap and the DOM are tools, not camps. They show the same data in different ways and complement each other, and you decide which you get along with better.
  • The order book comes after the market analysis. You look at it when the market runs into a zone you determined beforehand through institutional trading interest.
  • Five factors before every trade. You go through active and passive market participants, market and auction speed, price action and order flow events before you enter.

“Every transaction that takes place on the exchange always has two sides, a buyer and a seller.”

Oliver Sparing in the WH SelfInvest webinar (translated from German)
19

About the webinar

The webinar ran on October 10, 2024 on the YouTube channel of WH SelfInvest Deutschland, hosted by Stefan Fröhlich. WH SelfInvest is a broker. It is held in German; on YouTube, you can switch on machine-translated subtitles. Oliver is a regular guest there; you can find all appearances on our guest appearances page.

Note: the video is a recording from 2024. Brand and company names as well as offers in the video reflect the status at that time.

Day trading programme
How does the order book fit your trading?
Reading the order book is a craft that you learn step by step. In our day trading programme, you learn to put it into context with your market analysis. The programme is currently offered in German.
Day trading programme (German)
Frequently asked questions
What is the difference between the heatmap and the DOM?

The DOM is the classic order book and shows in real time how many limit orders sit at the individual prices. The heatmap records the order book over time: the warmer the color, the larger the order, and you see how long it has already been sitting there. Both show basically the same data, but in different ways, and complement each other.

Why does the price not rise even though more market buys take place?

On the other side, limit sellers can absorb the market buyers: each time the existing orders are worked through, they add new limit orders. Price then does not get through until one side runs out of strength. That is one reading of the pattern; order book data alone does not show who is trading there.

Can you trust every order in the order book?

Not without further checks. As long as an order is not executed, it can be canceled at any time. With a large order that has been in the market for a long time, there is a lot to suggest that it is real, but that is not a sure sign. The fact that an order disappears does not prove spoofing either: whether there was intent to deceive behind it cannot be read from the order book. Spoofing is prohibited at the CME.

What do dark pools have to do with the order book?

Dark pools are alternative trading venues for securities, above all stocks and ETFs; ES futures are not traded there. What they share with the order book is the approach of large market participants to leave as few traces as possible in the public order book. Executed dark pool trades are reported and show up in the trading data with size and price, but without an indication of whether the buyer or the seller took the initiative.

Oliver Sparing
Oliver Sparing
Founder & Head of Trading · TradeNeon
Oliver Sparing has been actively trading the financial markets since 2011. His professional roots lie in precious metals trading in Hamburg; in 2017 he learned at a London trading floor. At TradeNeon he leads the day trading and swing trading programmes and is responsible for the trading methodology, with a focus on order flow, market structure and fundamental market data. Level of Interest, Futures Insights and Lab of Trades grew out of this work. Platforms such as ATAS, Bookmap and WH SelfInvest regularly invite him as a guest. All guest appearances