COT Data in Trading: How to Read Positioning

COT Data in Trading: How to Read Positioning

Three anonymous figures with object heads arrange unlabelled position tiles on a table.
Swing tradingMarket analysis

COT data in trading: Reading positioning

Who holds long and short positions in the futures market? The weekly Commitments of Traders report offers a partial view. It reveals neither any individual trader's motive nor the next price move. Read in context, it can help you understand positioning and the wider market.

The figures represent trader groups; the tiles represent their reported positions.Image: TradeNeon

Imagine playing poker and finding out afterwards how different groups bet, without seeing any individual player's cards. CoT data offer a similarly limited view: they show past, aggregated positions of reportable trader groups. This article explains who those groups are, how to compare their positions over time, and why that comparison alone is not an entry signal.

01

What are CoT data?

Before going deeper, let's clarify the basics: what are CoT data, and why might you consider them in trading? The CoT reportsWeekly CFTC reports on the open positions of different trader groups as of the preceding Tuesday. were not invented by trading gurus. They are published by the Commodity Futures Trading Commission (CFTC), the US regulator for derivatives markets where, among other instruments, futuresStandardised contracts on an underlying asset with a specified size and expiry. are traded.

The aim is transparency. The CFTC's predecessor began publishing monthly CoT reports in 1962, showing how different groups of market participants were positioned in US futures markets. The first monthly report covered 13 agricultural commodities. The CFTC later continued the series; the reports have appeared weekly since 2000.

Today, the reports cover numerous markets, from gold and crude oil to financial futures. The CFTC normally publishes them on Fridays at 3:30 p.m. US Eastern Time, using positions from the preceding Tuesday; holidays can shift the release. This is not a live data stream, but it consists of reported figures rather than estimates. You see more than the fact that gold's price rose: you see how reported trader groups were positioned. Individual traders and their intentions are not disclosed.

02

Who appears in the CoT report, and what can their positions tell us?

To understand CoT data, distinguish between trader groups. A commodity producer may hedge price risk; a fund may follow another strategy. There are also several CoT report formats.

The groups in the Legacy CoT report

Originally, the report now called the Legacy format was the only CoT report. It broadly divides participants into three groups:

Commercials

Large participants with a hedging interest, such as producers, merchants and processors.

Non-Commercials

Large investors with speculative trading intentions, such as hedge funds.

Non-Reportables

The remaining participants whose positions are part of the market but fall below the reporting threshold.

Why the Disaggregated Report exists

In the Legacy report, physical merchants and financial institutions can appear together as Commercials. For example, a bank hedging an index fund's oil exposure through futures may appear alongside oil companies. In 2009, the CFTC introduced the Disaggregated Report, which separates reportable traders more finely by their predominant business activity. The Legacy report remains available.

The groups in the Disaggregated CoT report

The main groups in the Disaggregated report are:

Producer / Merchant / Processor / User (PMPU)

This group mainly comprises companies whose primary business is connected to the physical commodity market, such as mining companies, agricultural producers and food businesses. They mainly use futures to hedgeTo limit a price risk with an offsetting position; a hedge does not eliminate every risk. business risks. A wheat producer, for example, may sell futures to protect against a fall in crop prices. A large bakery may buy futures to limit its purchase price risk.

PMPU traders can therefore be identified more clearly as a group with a physical business connection. Unlike in the Legacy report, Swap Dealers are not included in this category. That makes the group easier for traders to interpret.

These participants know their industries well. An unusual position can therefore be a clue to their risks and market environment. It does not show whether every position is a hedge, whether PMPU traders think the price is cheap, or whether prices will rise over the medium to long term.

Even within this group, however, the boundaries can blur. Some PMPU traders may use their market knowledge speculatively as well. That does not erase the value of the category, but it does qualify what we can infer from it.

Managed Money

Managed Money includes investment funds, hedge funds and asset managers, for example. The CFTC classifies traders by their predominant business activity. The category alone reveals neither the motive for every position nor a reliable forecast. Changes in this group's positions can still be useful to examine. Their holdings may follow a trend. Common, but by no means inevitable, patterns include:

  • Long positions may increase in rising markets
  • Short positions may increase in falling markets

That can make their movements easier to follow. Depending on the market, changes in their positions may reinforce a trend or provide a warning sign.

Swap Dealers

Swap Dealers trade swaps and other derivatives, including for clients. Their hedges may appear as futures positions in the report. The Disaggregated Report separates them from producers, merchants and processors. Their reported futures position reveals neither the risk of their full book nor their clients' motives.

Other Reportables

This is a mixed group of larger reportable participants who do not fall under Managed Money—for example, family offices or very well funded private investors. Their strategies differ, making them harder to interpret. At times they may act like speculators, at other times like hedgers.

Non-Reportables

This is the calculated residual for positions held by traders below the reporting threshold. The report does not tell us how many are private traders. Their share of open interestThe number of futures or options contracts still open; it is not daily trading volume. varies by market and reporting date.

03

How should you analyse CoT data?

A net position says little on its own. A comparison with earlier reports shows whether a group was unusually positioned. Two hundred thousand net short contracts may be ordinary in one market and remarkable in another. You need a historical series to judge the difference.

Analysing CoT data manually or with software

If you enjoy working with tables and do not mind updating data regularly, you can go straight to the source. The CFTC offers a free CoT data environment. You can filter reports by market and period and export data; HTML reports and historical files are also available.

The catch is that the reports are extensive. If we open the Disaggregated Futures Only report for the Agriculture sector as an HTML page, we get a view like this:

WHEAT-SRW - CHICAGO BOARD OF TRADE                                                                                                               Code-001602
Disaggregated Commitments of Traders - Futures Only, May 20, 2025
-------------------------------------------------------------------------------------------------------------------------------------------------------------
     :          :                                              Reportable Positions                                                      :   Nonreportable
     :          :  Producer/Merchant/ :                                :                                :                                :     Positions
     :   Open   :   Processor/User    :          Swap Dealers          :         Managed Money          :       Other Reportables        :
     : Interest :   Long   :  Short   :   Long   :  Short   :Spreading :   Long   :  Short   :Spreading :   Long   :  Short   :Spreading :   Long  :  Short
-------------------------------------------------------------------------------------------------------------------------------------------------------------
     :          :(CONTRACTS OF 5,000 BUSHELS)                                                                                            :
     :          :    Positions                                                                                                           :
All  :   478,028:    90,281     55,748     70,078      5,531     20,498     93,184    193,725    111,715     34,517     33,602     22,615:   35,140    34,594
Old  :   470,119:    88,187     53,760     69,739      5,792     20,017     91,913    194,524    109,879     36,381     33,179     19,513:   34,490    33,455
Other:     7,909:     2,094      1,988        816        216          4      3,107      1,037          0        184      2,471      1,054:      650     1,139
     :          :                                                                                                                        :
     :          :    Changes in Commitments from:       May 13, 2025                                                                     :
     :    -3,459:    -5,953      6,044     -1,238        161      1,837      5,063    -14,937      6,035     -3,368     -1,842     -1,664:   -4,171       907
     :          :                                                                                                                        :
     :          :    Percent of Open Interest Represented by Each Category of Trader                                                     :
All  :     100.0:      18.9       11.7       14.7        1.2        4.3       19.5       40.5       23.4        7.2        7.0        4.7:      7.4       7.2
Old  :     100.0:      18.8       11.4       14.8        1.2        4.3       19.6       41.4       23.4        7.7        7.1        4.2:      7.3       7.1
Other:     100.0:      26.5       25.1       10.3        2.7        0.1       39.3       13.1        0.0        2.3       31.2       13.3:      8.2      14.4
     :          :                                                                                                                        :
     :          :    Number of Traders in Each Category                                                                                  :
All  :       370:        84         67         23          7         14         51         80         69         55         43         40:
Old  :       370:        84         66         23          7         14         51         80         67         56         41         40:
Other:        71:        14         25          5          .          .          8          7          0          .         11          9:
     :-------------------------------------------------------------------------------------------------------------------------------------------------------
     :             Percent of Open Interest Held by the Indicated Number of the Largest Traders
     :                          By Gross Position                       By Net Position
     :               4 or Less Traders     8 or Less Traders     4 or Less Traders     8 or Less Traders
     :                 Long:     Short       Long      Short:      Long      Short       Long      Short
     :----------------------------------------------------------------------------------------------------
All  :                 12.3       16.5       21.1       27.4        8.9       11.6       15.0       19.9
Old  :                 12.5       16.8       21.4       27.8        9.0       11.7       15.2       20.2
Other:                 52.5       43.8       68.9       64.0       51.2       43.3       63.2       59.3

Wheat, 20 May 2025. This historical report keeps the dense original layout; scroll sideways on narrow screens. Original CFTC report

This historical report shows why working with raw data takes time: you must select the relevant trader groups and figures and compare them regularly. You can import CFTC files into a spreadsheet yourself or use software. Neither replaces your interpretation of the data.

Two ways to add historical context
Manually

Open CFTC reports, select relevant figures and keep your own overview up to date.

With software

View CoT data alongside other market data in a tool and compare historical positions.

Analysing CoT data: a 2025 example

The Academy example from June 2025 examines soybean meal (ZM). The following historical chart shows the long and short positions of Managed Money. It does not describe current market conditions.
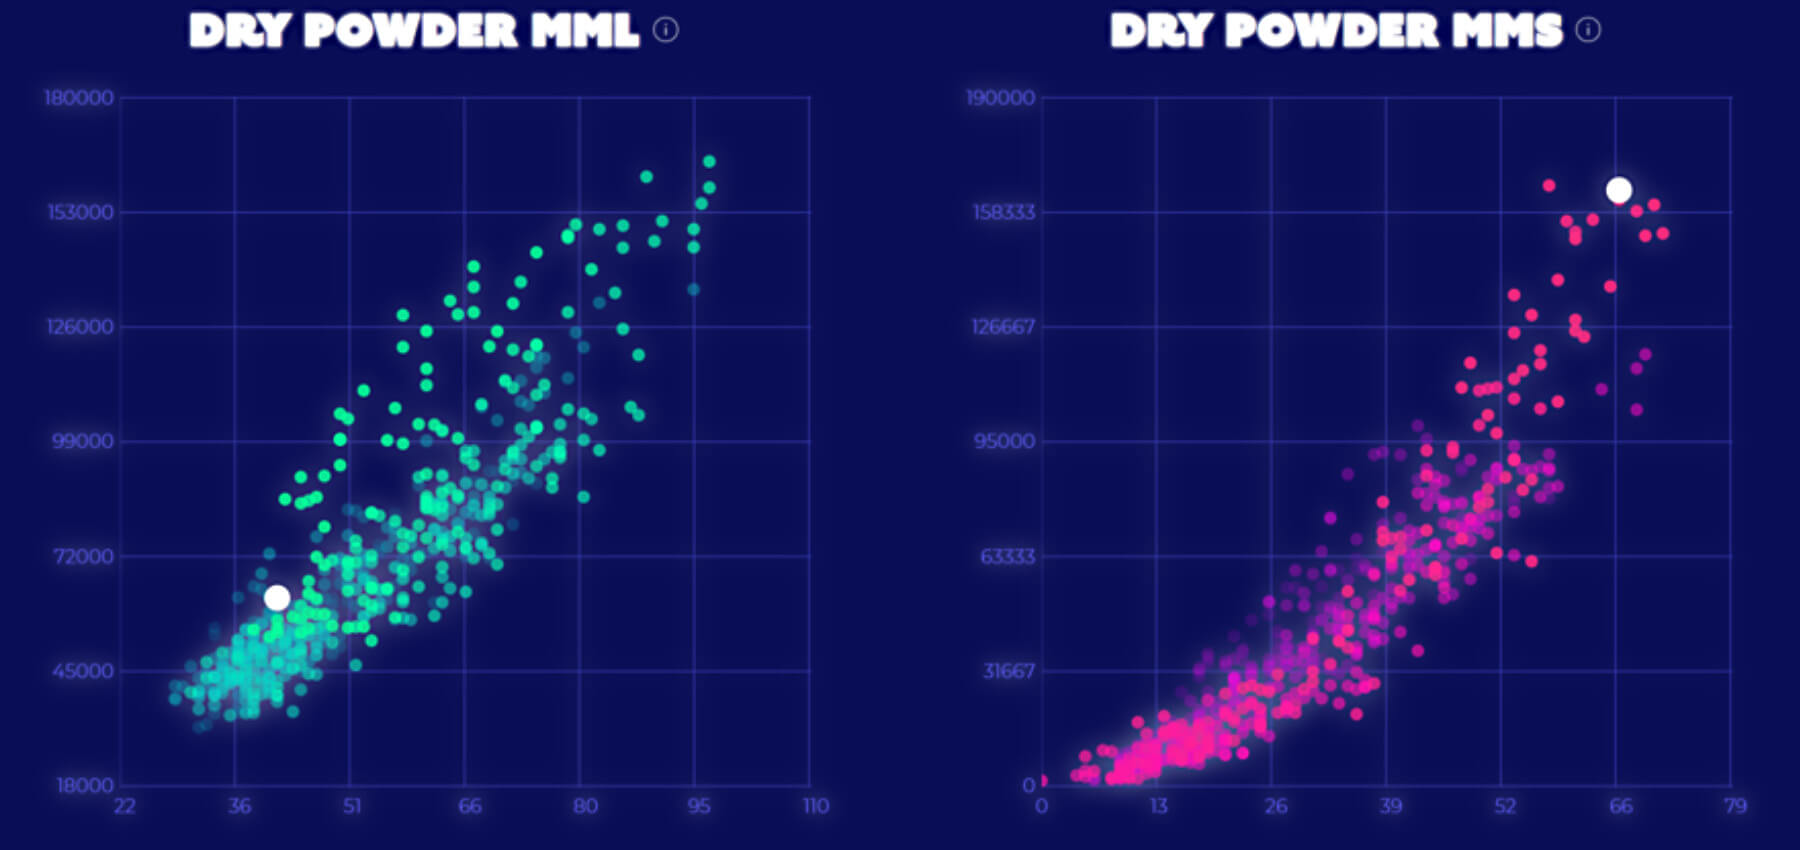
Historical Dry Powder chart of Managed Money long and short positions in the 2025 Academy example.
Futures Insights view from the 2025 Academy example. The dots show historical positions, not current market conditions. Open full size.

White dots mark the positions at that time; coloured dots show earlier values. In the historical comparison, the long position was unremarkable. The short side was unusually crowded. That judgement depends on past values, rather than the absolute number of contracts alone.

Looking at Managed Money's short position at that point, one thing stands out: the group was heavily short. Its short holdings grew during the downtrend shown in the historical example. The CoT report alone cannot tell us whether, or to what extent, that group moved the price.

In the historical Dry Powder MMS (Managed Money Short) image, only one short position in the ten-year period up to June 2025 contained even more short contracts.

The short extreme at the time provided useful market context. It placed no limit on new short positions and did not predict a reversal. CoT data provide clues, not certainty.
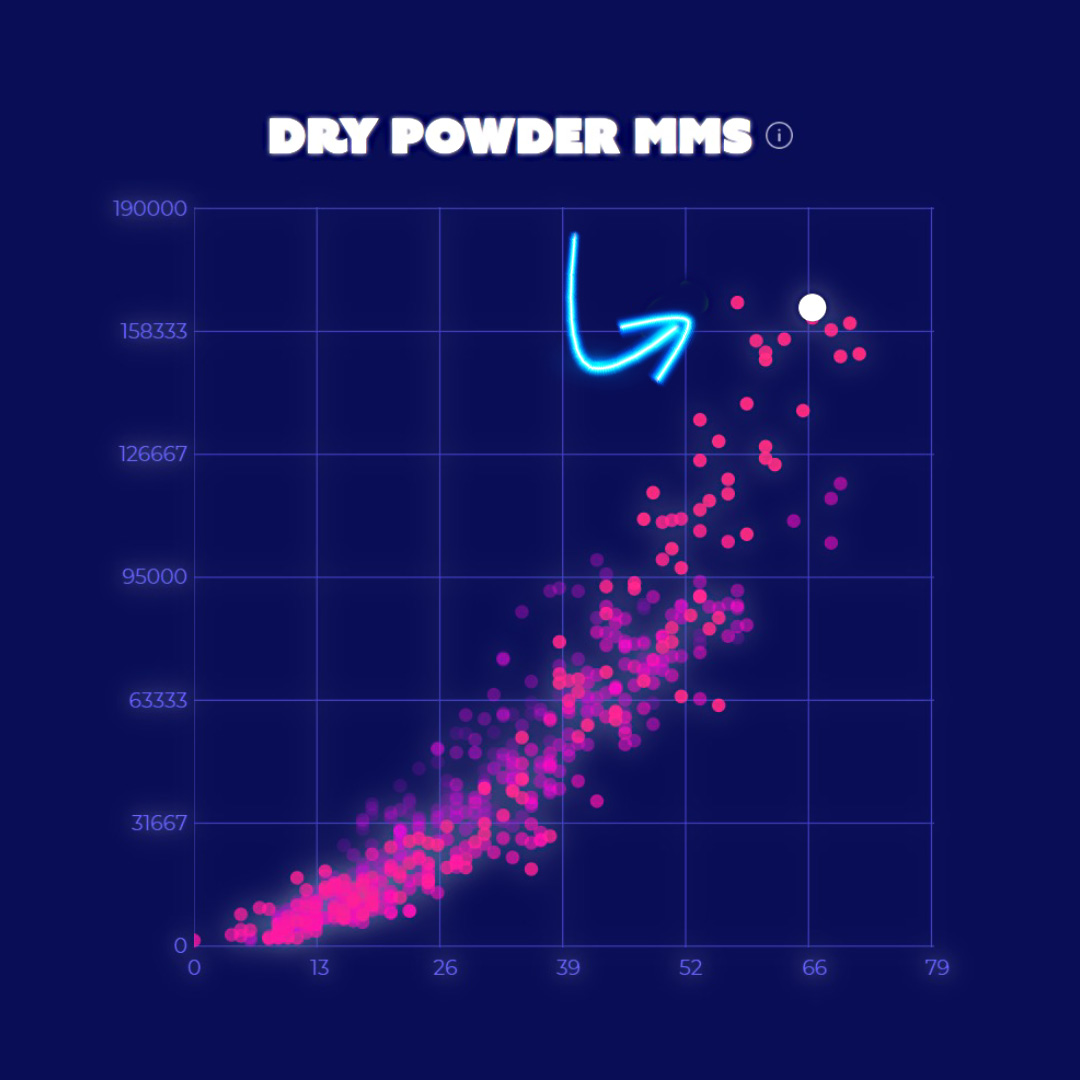
Historical Dry Powder Short chart with one white dot above many earlier pink dots.
Short positioning in the 2025 Academy example. The highlighted dot does not describe the current CoT situation. Open full size.

How should you use CoT extremes?

An extreme position is no reason to enter a trade immediately. Positions can become more extreme while a trend continues. Assess the longer-term market context and wait for your own chart setup before entering.

So what should you do? Once you think a long position makes sense from a fundamental perspective, the next step is chart analysis. Only when the market also offers a suitable price area and a clean setup can a CoT idea become a trade. CoT data help with the “what”; the chart helps with the “when.”
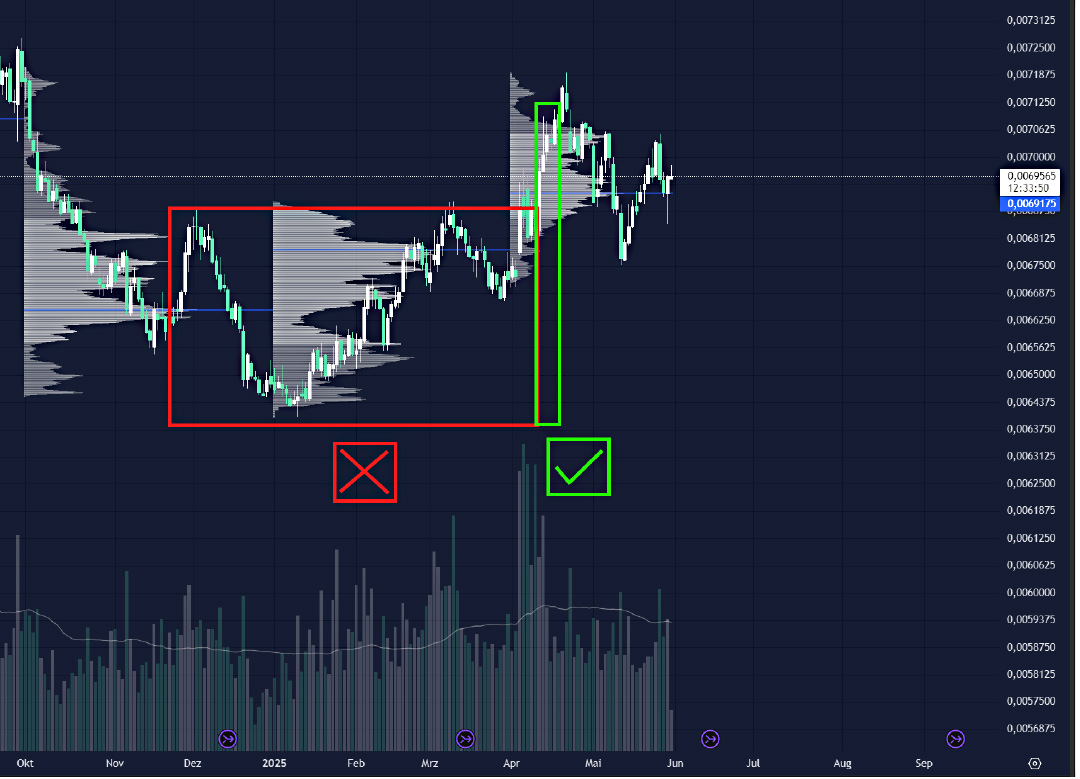
Historical candlestick chart with a red frame around a long sideways phase and a green frame around a later breakout.
Simon's chart from the Academy article illustrates the difference between market context and entry timing. No market label is legible in the crop. Open full size.

CoT data in fundamental context

A Managed Money position alone does not describe the entire fundamental picture. Compare it with physical traders' positions, seasonal patterns, the futures curve and other market measures. Several clues can support an idea; they cannot prove the future price direction.

1. PMPU positioning

It is particularly interesting when producers, processors and other PMPU traders also reach a historical extreme. If both groups are unusually positioned, examine the market context more closely; a good trade does not automatically follow.

2. Other important fundamental influences

  • Seasonality: are there typical market moves at certain times of year?
  • The structure of the futures curveA comparison of prices for futures contracts with different expiry dates.: is there contango or backwardation, and what might that say about supply and demand?

3. Broader context

CoT positions can become more useful when you compare them with other variables:

  • Current price: is the market historically expensive or cheap?
  • Number of active participants: are there unusually many or few?
  • Total open interest: how many contracts are open overall?
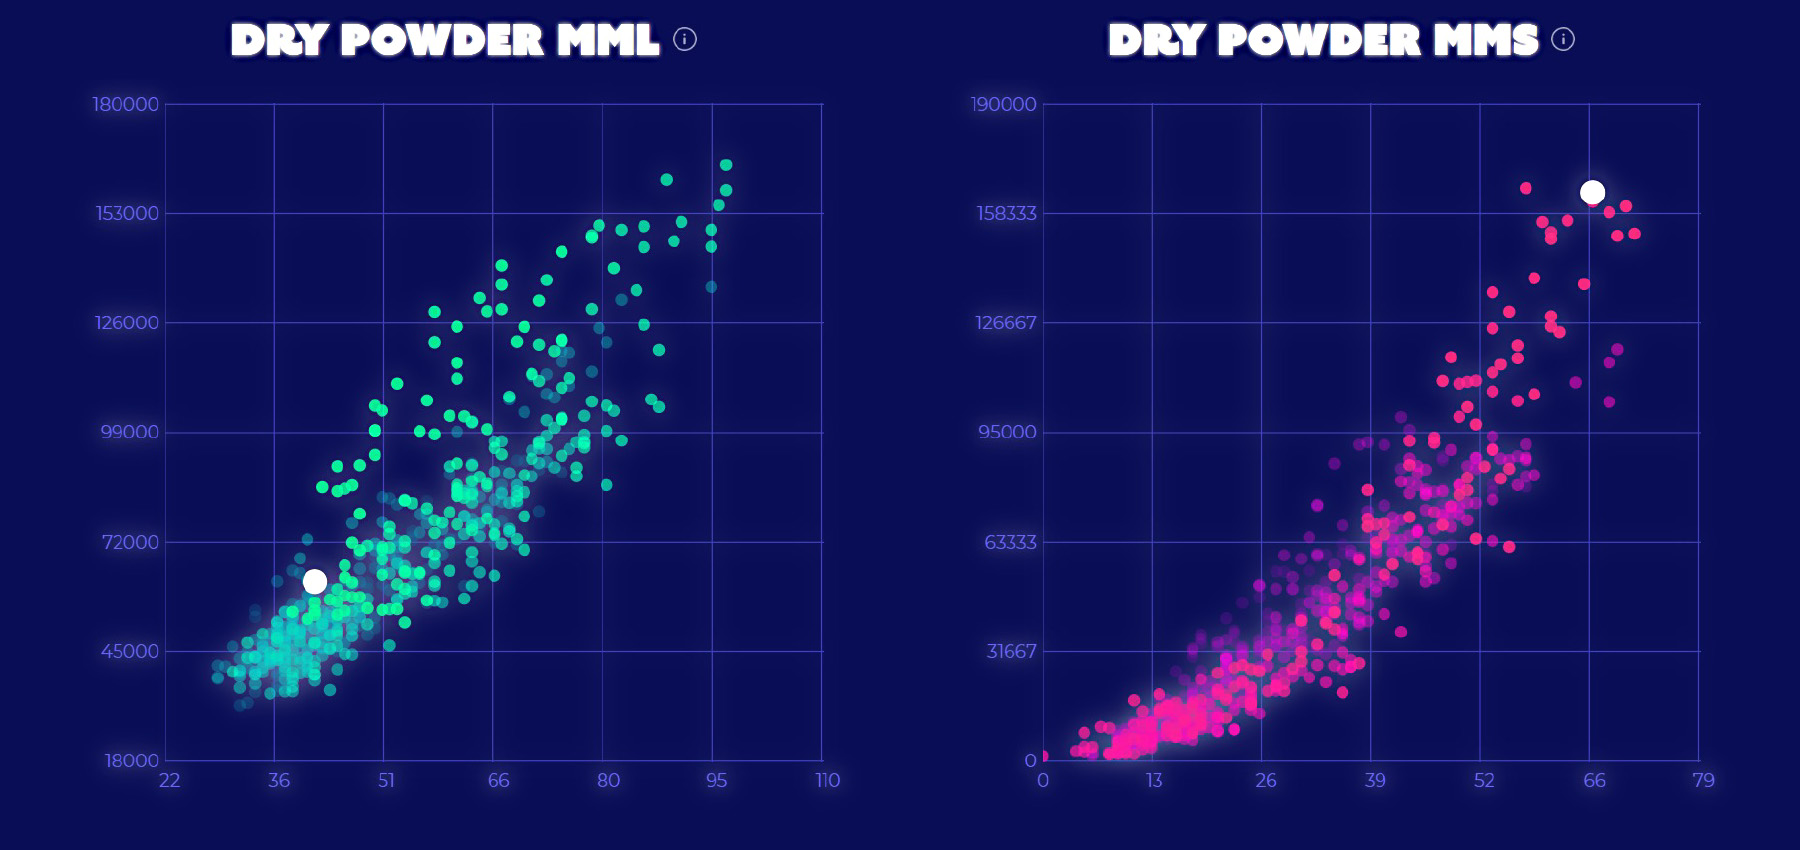
Second historical Futures Insights view of Managed Money Long and Short Dry Powder values.
Another view of Managed Money positions in the 2025 Academy example. This image does not show current market conditions. Open full size.

How extreme a Managed Money position appears also depends on total open interest. Compare its size with earlier positions and the market phase. The next historical image offers another view of the 2025 example; the subsequent OBOS indicator adds context.
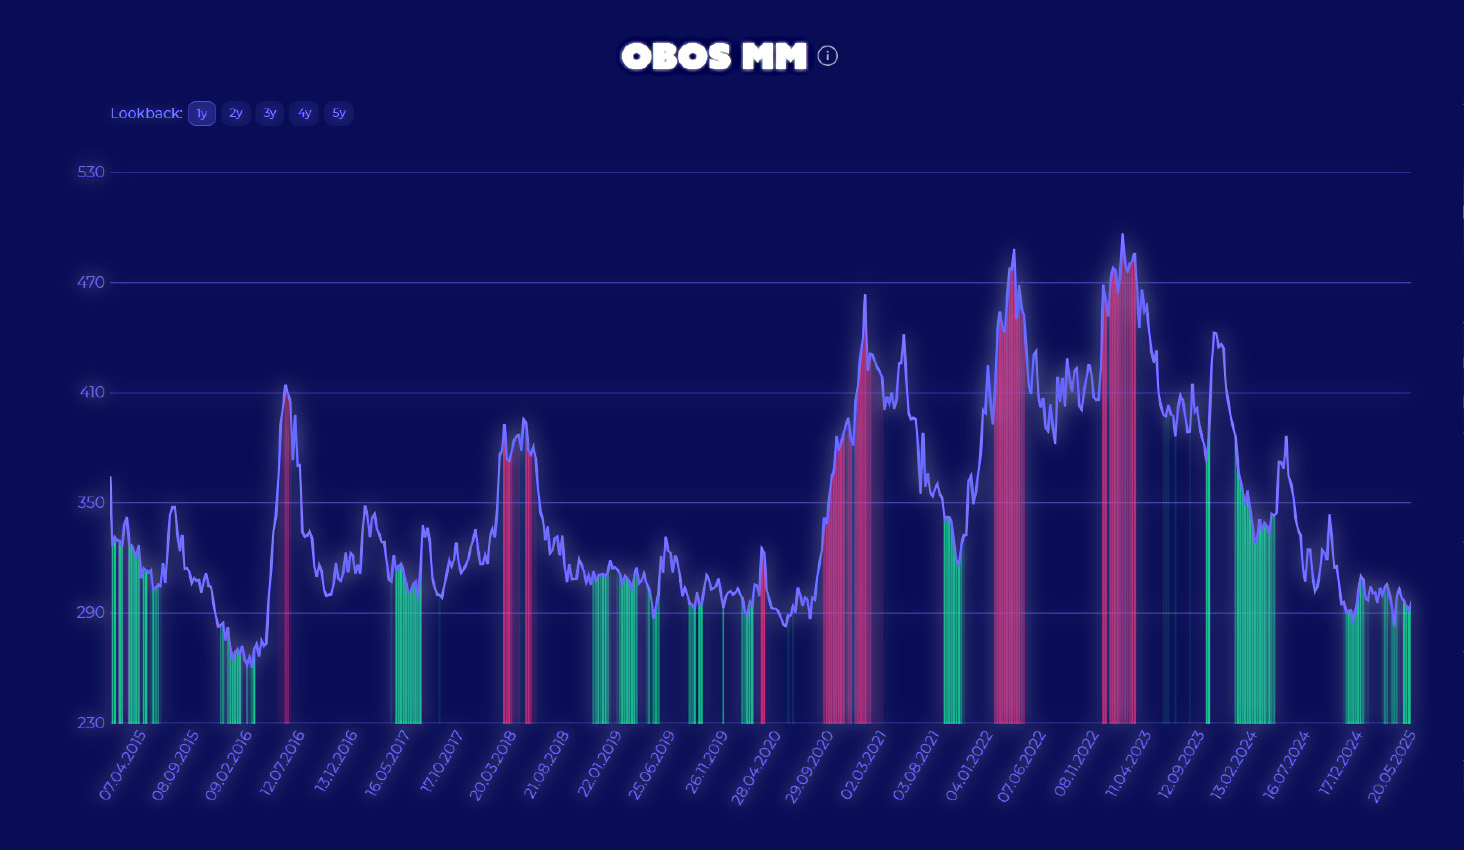
Historical OBOS MM indicator with a timeline from 2015 to May 2025.
Historical Futures Insights view up to May 2025; its design and values are not the current product or market state. Open full size.
04

Which markets are particularly suited to CoT analysis?

Not every market is equally suited to CoT analysis. Reportable physical participants, sufficient open interest and a meaningful historical comparison matter. The following criteria help you choose.

What makes a market suitable for CoT analysis?

Look for markets in which:

01

Commercial interest and physical participants

There is a clear commercial interest in hedging, and commercial participants are active in the physical commodity market.

02

High open interest

A substantial number of contracts remain open. Open interest helps put positions into perspective; a high value does not automatically make a price forecast more reliable.

03

Seasonal patterns and cycles

Historical cycles and seasonal patterns are present. Markets with a seasonal character often show recognisable positioning patterns, which can make CoT data more informative.

Markets of interest to CoT traders

Given those criteria, the following four groups of futures markets are worth examining:

Energy and metals8 markets

These commodities are tied to the physical economy. Examples include:

MarketExchange code
GoldGC
SilverSI
PlatinumPL
CopperHG
Crude oilCL
Natural gasNG
Heating oilHO
Gasoline (RBOB)RB

These markets have strong links to physical demand, sizeable commercial participants and active Managed Money positions.

Agricultural markets9 markets

Grains and soft commodities often show seasonal patterns. Examples include:

MarketExchange code
CornZC
WheatZW
SoybeansZS
Soybean mealZM
Soybean oilZL
CocoaCC (ICE)
CottonCT (ICE)
CoffeeKC (ICE)
SugarSB (ICE)

You may see distinct seasonal phases and positions taken by Commercials against the prevailing price trend, such as buying around harvest lows.

Livestock markets2 markets
MarketExchange code
Live cattleLE
Lean hogsHE

These markets are strongly shaped by biological production cycles. Commercial participants such as feedlots and meat processors often hedge price fluctuations, which can also produce noticeable positions depending on the market and period.

Currency markets6 markets
MarketExchange code
Australian dollar6A
British pound6B
Canadian dollar6C
Euro6E
Japanese yen6J
Swiss franc6S

CoT data can also be informative here, particularly about the speculative positions of large funds. For financial futures, including currencies, the CFTC uses different trader groups in its Traders in Financial Futures report. Participants in these markets may hedge risks as well; the classification simply differs from that used for commodities.

The 26 markets in Futures Insights 2.0

Futures Insights 2.0 groups 26 futures markets into eight classes. The Free Plan gives you gold (GC) with all indicators; paid plans unlock all 26 markets.

Metals4
  • GCGold
  • SISilver
  • PLPlatinum
  • HGCopper
Energy4
  • CLWTI crude oil
  • HOHeating oil
  • RBGasoline
  • NGNatural gas
Livestock2
  • LELive cattle
  • HELean hogs
Currencies5
  • 6EEuro
  • 6BBritish Pound
  • 6JJapanese Yen
  • 6AAustralian Dollar
  • 6CCanadian Dollar
Grains5
  • ZCCorn
  • ZWWheat
  • ZSSoybeans
  • ZMSoybean meal
  • ZLSoybean oil
Soft commodities4
  • KCCoffee
  • CCCocoa
  • CTCotton
  • SBSugar
Indices1
  • ESE-Mini S&P 500
Volatility1
  • VXVIX future
05

Your path to structured swing trading

Calm, efficient and grounded.

In our swing trading programme, you learn to use CoT data, seasonality and price dynamics deliberately—with a clear, adaptable framework rather than rigid strategies.

It is aimed at people who want to understand trading thoroughly and develop their approach over time.

06

Final thoughts

CoT data show past group positions. In historical context, they can inform a market view, but they confirm neither an entry nor a future price direction. A trading decision still needs your own rules and a suitable setup.

If you want to use CoT data, seasonality and other factors in a structured process, you can learn more in our swing trading programme.

Simon and the TradeNeon Academy team

Start with the gold market
Try gold (GC) with all indicators in the Futures Insights Free Plan. When you want to analyse more markets, Futures Insights 2.0 covers 26 in total.

Free · no credit card · upgrade anytime

TradeNeon capybara mascot in a UFO
Frequently asked questions
When is COT data released?

The regular release is Friday at 3:30 p.m. US Eastern time and describes open positions as of Tuesday. Holidays or exceptional circumstances can change the schedule.

Is COT data an entry signal?

No. It describes past group positions. Entry timing, price and risk must come from your own method.

Was the Legacy Report discontinued?

No. The CFTC still publishes both Legacy and Disaggregated reports. They group traders differently.

Does it show what a particular major trader plans to do?

No. It shows aggregated positions and categories, not the intention or strategy of an individual participant.


Simon Reichert
Simon Reichert
Swing trading coach · TradeNeon
Simon Reichert coaches swing trading at TradeNeon. His focus is market context, position risk and the assessment of trading ideas.
Order Flow in Trading: Understanding Market Moves

Order Flow in Trading: Understanding Market Moves

Anonymous figure with a glass grid head between streams of blue and violet glass beads.
Day tradingMarket mechanics

Order flow in trading:
Understanding market moves

A price chart shows where trading occurred. Order-flow data adds a view of the orders displayed in the book and the trades actually executed. At a price level you identified beforehand, this can help you assess the reaction. It cannot reveal an individual trader's intent.

Displayed orders and executed trades are two different data streams.Image: TradeNeon

Imagine standing beside a river. You can see the water at the surface, sometimes calm, sometimes rushing, while the currents underneath stay out of sight. You may know a similar moment in the market: your setup looks sound, price is about to break out of a range, you enter – and it turns back.

The chart shows where trading took place. An order-flow viewOrder flow concerns changing orders and executions. It shows market activity, but not an individual trader's motives. adds which orders were displayed in the book and which trades actually executed. This can help you examine what happened at a level you selected beforehand. It cannot reveal why a particular trader acted or where price must go next.

After a failed breakout, you may first look to candles, lines or indicators for an explanation. That is where the reversal is visible. To examine how trading unfolded at the range boundary, you need a closer look at executions and the displayed order book. Even those data do not provide a complete story. They add to the chart observation and may challenge a hasty explanation.

The idea behind this article

Market analysis provides the where: a price area where you expect a response. Order flow adds the what: displayed orders, executed volume and price reaction. Together, these observations give context to your decision.

01

What order flow shows – and what it does not

A chart compresses past trades into candles or lines. You see the outcome of a move, but only part of the process. Order-flow tools let you look more closely at what was displayed at individual price levels and what really traded there. In exchange-traded futuresStandardised contracts with a defined underlying market, contract size and expiry., for example, these two kinds of data can be viewed side by side.

Before execution

Displayed limit orders

The order book shows offered buy and sell quantities. They can be added, changed or cancelled. They are not yet traded contracts.

After execution

Actual trades

Executions show where volume changed hands. Price and volume alone identify neither the participants nor their intentions.

A chart and an order-flow view answer different questions. The latter may show whether aggressive buys or sells occurred at a level, whether a lot traded in a narrow area and whether price then progressed. It cannot establish “genuine interest” or a particular hidden intention with certainty. A large displayed order may never execute.

Three questions help with this assessment: Are buyers or sellers entering aggressively? Does price stall despite those executions, or does it progress? And how does the displayed supply on the other side change? Heavy buying does not automatically mean rising prices. Every executed buy has a seller; the amount of liquidity available or replenished on that side also matters.

That is why order flow is no holy grail. Think of it as the screws and nails in a toolbox: useful alongside a plan, market analysis and risk rules. Without a connection to your trading idea, you will find conspicuous patterns everywhere. A brief volume spike or absorption in the middle of a move may simply be market noise.

CME explains how orders, changes and executions update the electronic order book. What depth you can actually see depends on the market, data feed and tool.

02

Why the “what” needs a “where”

Even if you can see what is trading now, a second question remains: where is it happening? For a trading idea aimed at a move lasting more than a few seconds, an arbitrary spike in delta or volume is not enough. You need a defensible area on the chart where a reaction would matter to your thesis.

Mark a support or resistance area, or the edge of a range, before price reaches it. Ask what response you expect and what would challenge your idea. When the market arrives, watch how displayed liquidity, actual trading volume and price progress relate to one another. Strong execution without further progress tells a different story from a breakout that trades through additional levels.

Do not chase every very short-term move. The smaller the time window, the less time you have to check an observation. Before price reaches your area, decide which data and timeframe you will use. A signal without context can tempt you to invent a story only after placing the trade.

1Mark a level

Why does this price area matter to your market analysis?

2Observe the reaction

What happens to executions, displayed depth and price?

3Look for another explanation

Could thin liquidity or a short impulse explain the observation too?

4Limit your risk

A pattern cannot replace a stop or sensible position sizing.

The “where” and “what” work like two interlocking gears. Market analysis shows where you might want to trade; order flow helps you assess the response there. A level you have marked is never a guarantee that the market will react as expected.

03

Reading the order book and heatmap

The order bookA view of displayed buy and sell orders at individual price levels, also called depth of market., or DOM, shows visible limit ordersOrders with a price limit: a buy may fill at or below the limit, a sell at or above it. Execution is not guaranteed. on the bid and ask sides. It is a snapshot. Orders are constantly placed, changed and cancelled. The displayed quantity is neither volume already traded nor a promise that it will still be there when price arrives.

A heatmap plots those displayed quantities over time as coloured traces. Bright areas generally represent more displayed orders in the particular tool. This helps you see where orders rested for longer, which levels price touched repeatedly and where displayed depth fell before price approached. The colour cannot tell you who traded or why an order disappeared.

A heatmap makes changes easier to follow than the flickering numbers in a DOM. A bright trace may show that a large quantity remained displayed at a level for longer. Repeated touches show how price behaved there. A fading trace shows that displayed depth changed. Only with the actual trades can you interpret these observations cautiously. A level that price did not trade through may reflect replenished orders or a lack of aggressive orders.

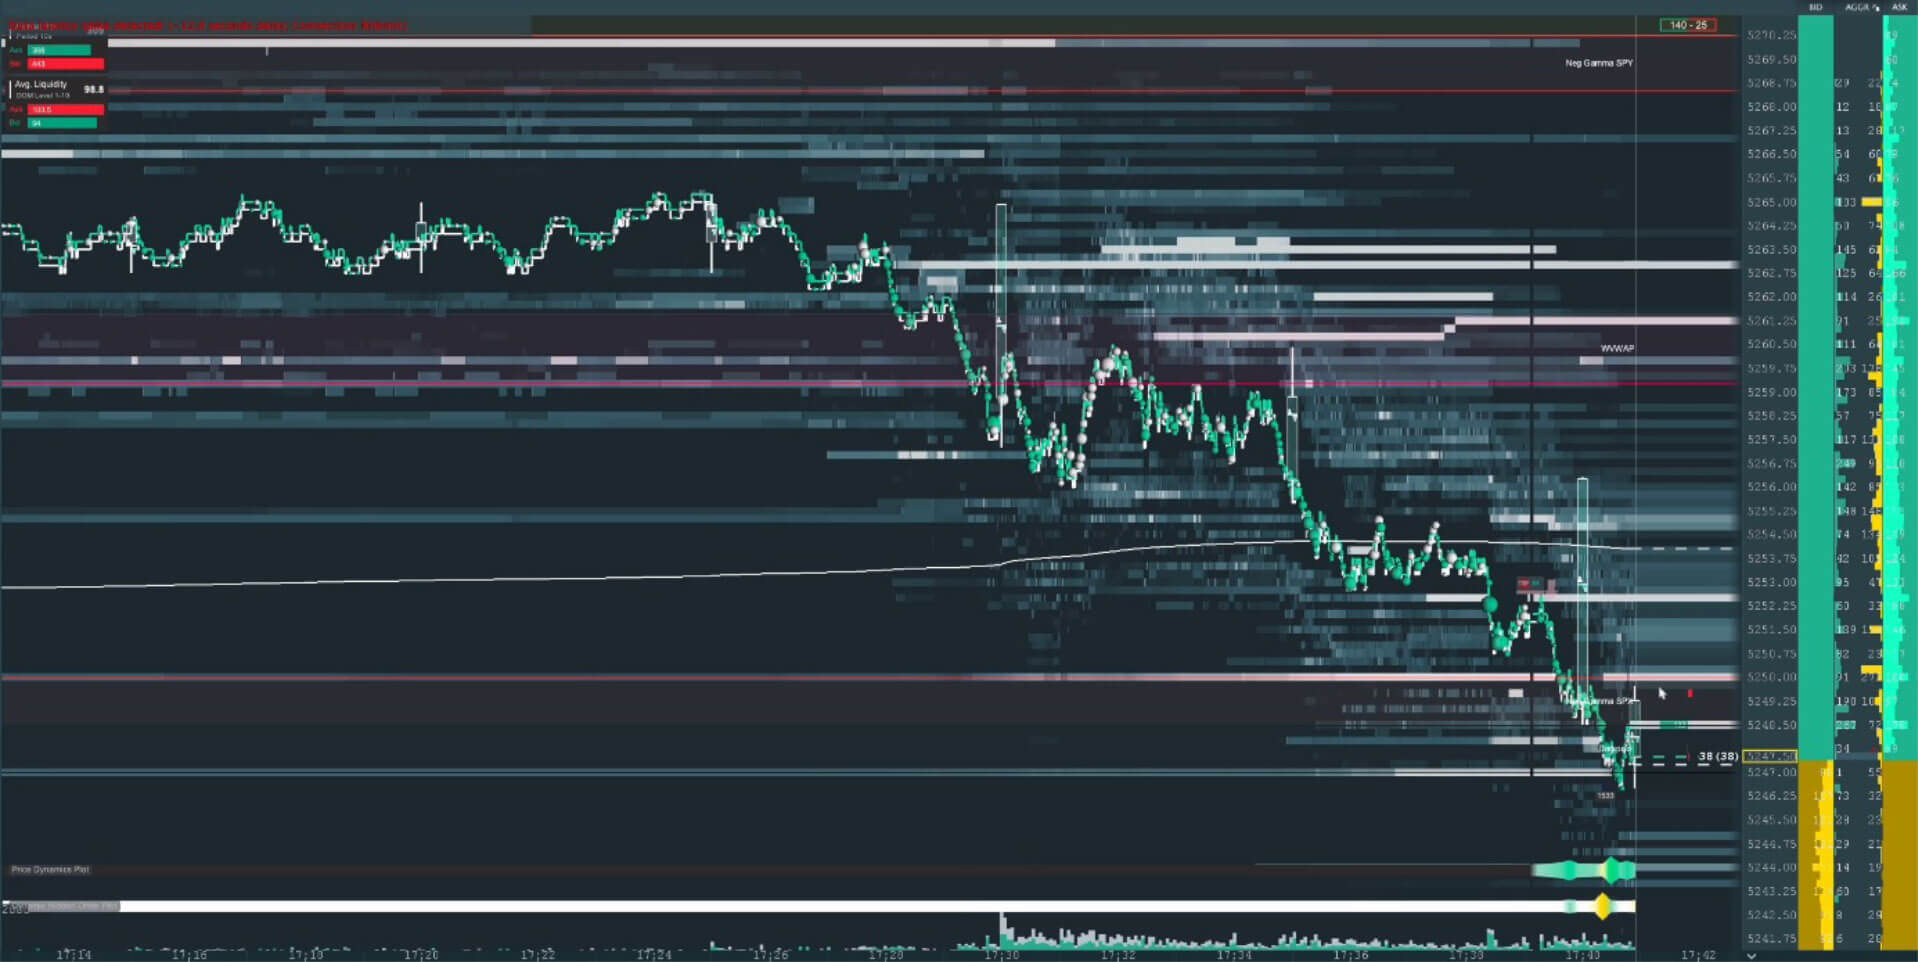
Historical Bookmap screenshot showing price, horizontal liquidity traces and volume.
Bookmap screenshot from 2025. Bright traces indicate displayed depth in the data feed used then. Open the image for detail; this is not a current market view. Image: TradeNeon.

In this view, Level of Interest added coloured horizontal lines to the heatmap to mark price areas identified through prior market analysis. Those lines are analysis, not executions or evidence of institutional orders. Level of Interest can point to areas worth another look; you assess the reaction there yourself.

If a bright trace fades, order changes and cancellations are possible explanations, as is the way the feed displays depth. That alone does not prove spoofing. CME cautions against using order-book depth alone to measure liquidity. Consider executions, the spreadThe gap between the best available bid and ask prices in a market. and price response too.

Other views

A volume profile groups executed volume by price level. Delta bars and footprint charts show aggressive buy and sell executions within a candle or at each price level. An order-book imbalance compares displayed buy and sell quantities, so it is different from executed volume. You do not need all these views at once. You do need to know what data each one actually shows.

04

What cumulative delta adds

A heatmap mainly describes what was visibly offered in the book. Order-flow delta instead compares aggressively executed buys and sells: trades at the ask are commonly assigned to the buy side and trades at the bid to the sell side. Cumulative delta sums that difference over a chosen period and is often shown as a line beneath the price chart.

If delta rises while price makes little progress at a level, passive sellers may be absorbing aggressive buys. That is a possible clue to absorption, not proof of a particular trader or an imminent reversal. If price rises without a strong delta impulse, several explanations remain possible, including fewer offers on the other side or changing limit orders. A sharp jump in delta indicates increased aggressive volume, but does not establish a single large order.

Three contrasts are particularly useful: pressure without a breakthrough, rising price without a strong delta impulse and a sudden jump in the delta line. All three are useful observations. A single certain explanation would go too far: rising delta with a stalled price does not prove one particular limit seller. A rise without a delta impulse does not prove “hidden strength”. And a sharp jump can consist of several executions. Compare timing, price response and data quality.

The contrast between price and delta makes this view useful. Compare them over the same period and keep your feed's calculation method in mind. Delta shows executed activity; it does not show all resting orders or identify the market participants.

05

Three order-flow patterns in examples

Absorption: much trading, little price progress

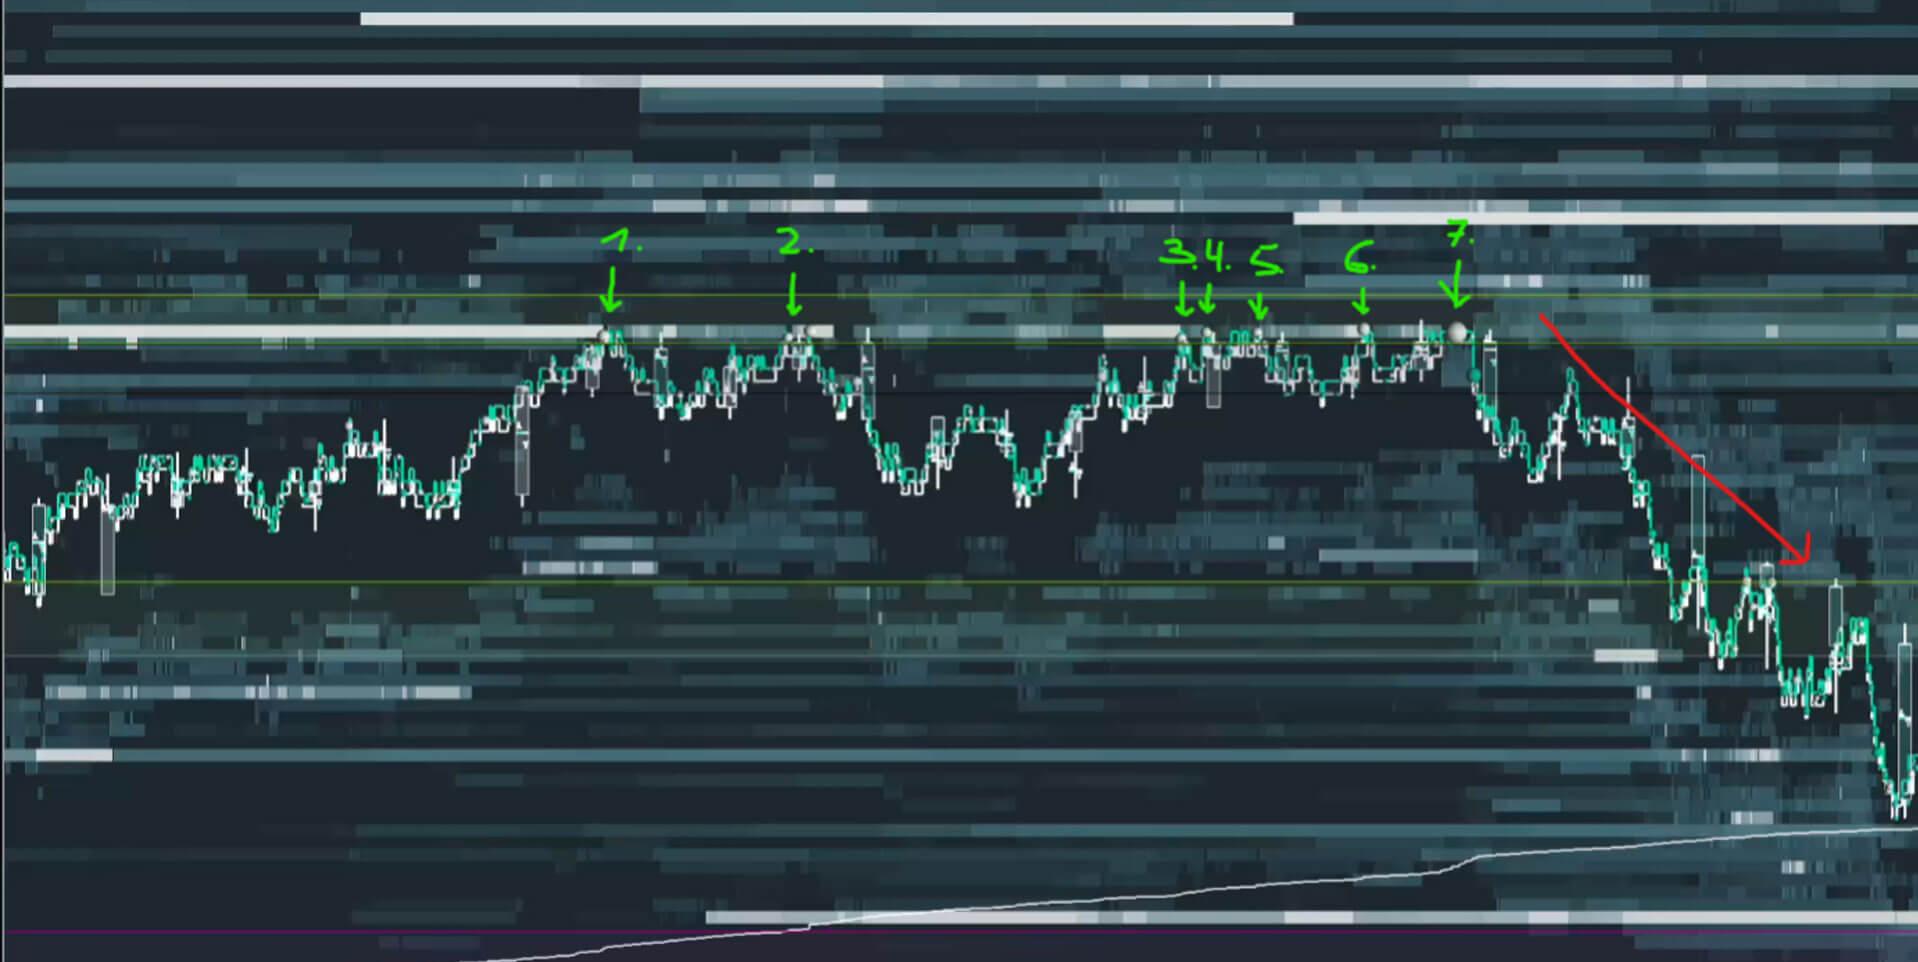
Imagine buyers repeatedly trading aggressively at resistance while price barely advances. One-sided delta, high executed volume in a narrow area and little price progress may appear together. Opposing passive limit orders could be absorbing the buying pressure. Who placed them, and what will happen next, remains unknown.

Historical heatmap chart with several marked tests of an upper price area followed by a decline.
Absorption example from 2025: several approaches to the upper area, followed by a decline. The image alone cannot establish which orders executed or why price later fell. Image: TradeNeon.

A large number in the order book is not enough to identify absorption. Look for the combination of actual executed volume and little price progress in the same area. Passive orders may be replenished, or the aggressive side may be weakening. The historical arrows in the image show where you would look more closely. They do not replace a time sequence of executions or a check of what happened afterwards.

In that historical example, the market fell after several attempts. It illustrates a past sequence, not a rule: absorption can also end without a reversal. At a level marked in advance, it is one piece of evidence to combine with other observations and your risk plan.

Sweep: trading through several price levels

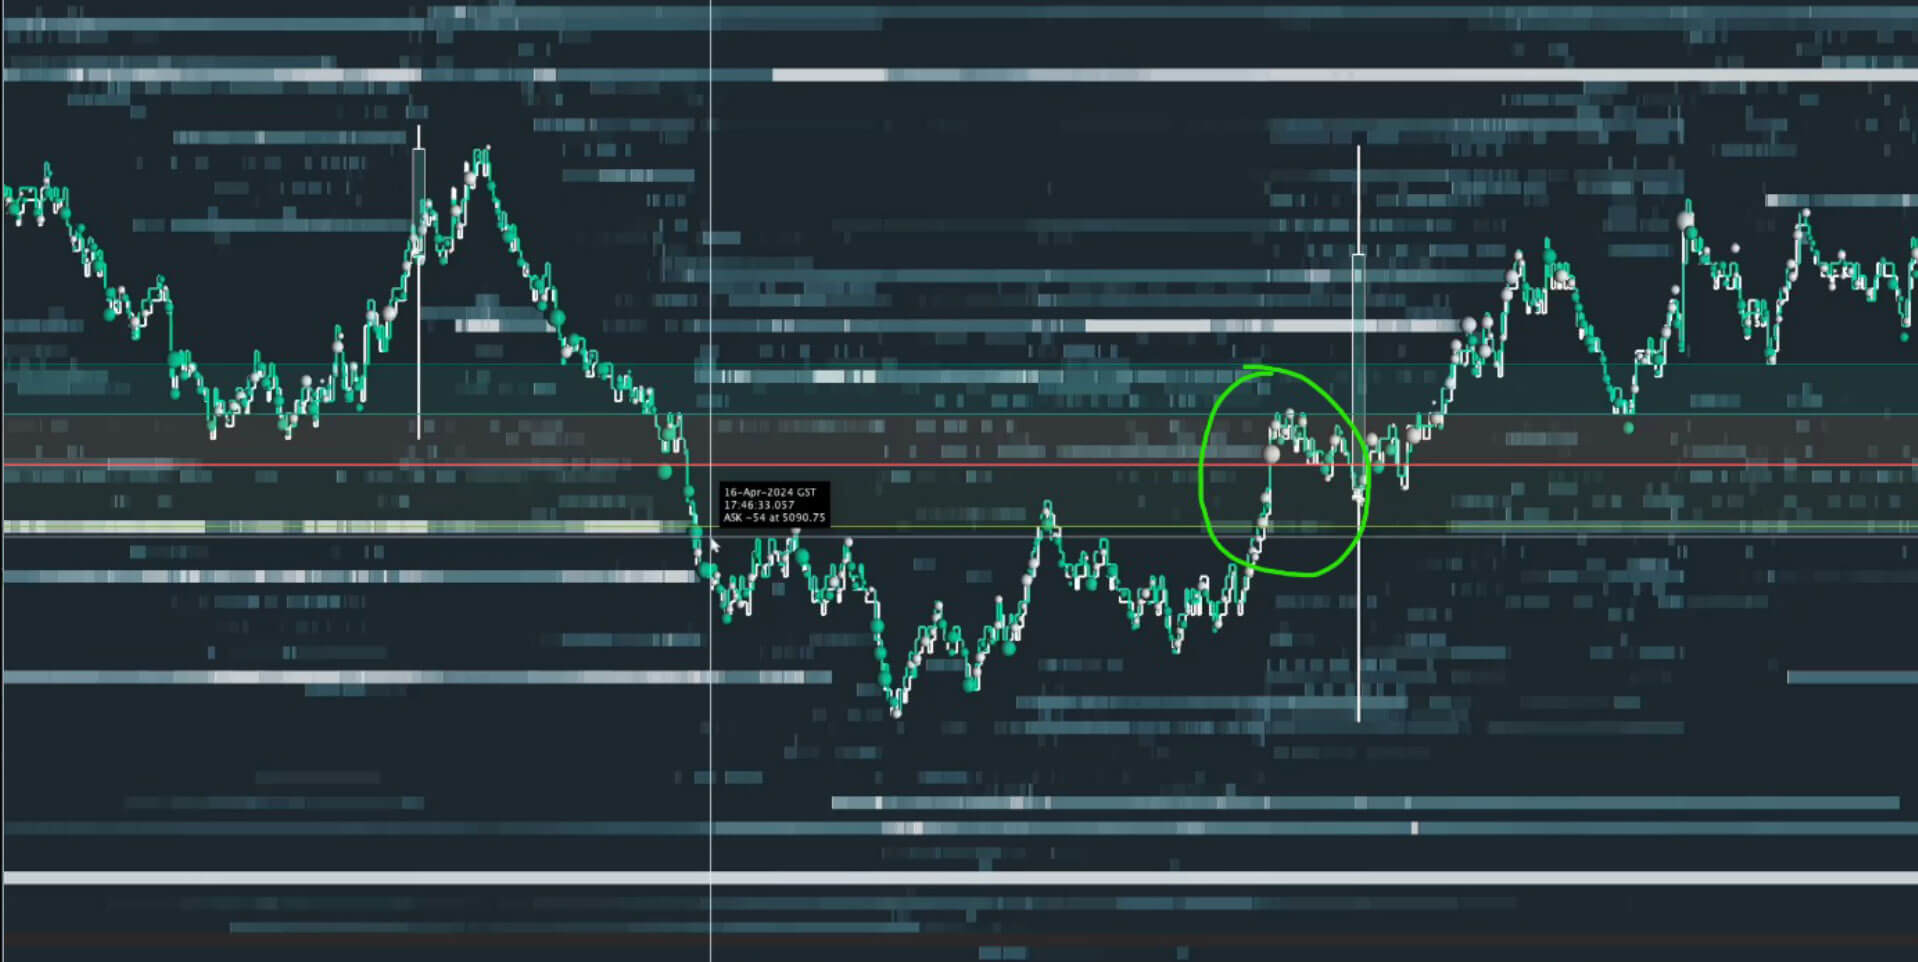
In a sweep, aggressive executions take available liquidity across several price levels. This can cause a rapid price move. The chart shows the move; suitable execution data lets you check which levels actually traded. Thin displayed depth may amplify it. A steep delta move or a screenshot does not reveal whether one large participant was responsible.

Historical heatmap chart with a marked fast price move at a price area.
Marked price move in a screenshot from 2025. The marking highlights an area to examine; execution data is needed to assess a sweep. The trader or traders involved remain unknown. Image: TradeNeon.

The example connects a fast price move with a previously examined microstructure. That connection is the useful lesson. The static picture alone cannot verify whether transactions took several levels in one sweep. Use it to frame questions for the execution data, not as a completed diagnosis. Several participants could also trade aggressively at the same time.

Location matters here too. A fast move halfway through an established run may be noise for your plan. At a level marked beforehand, ask the same questions: what actually traded, how did price respond and what other explanation is possible?

Disappearing orders: an observation, not proof of spoofing

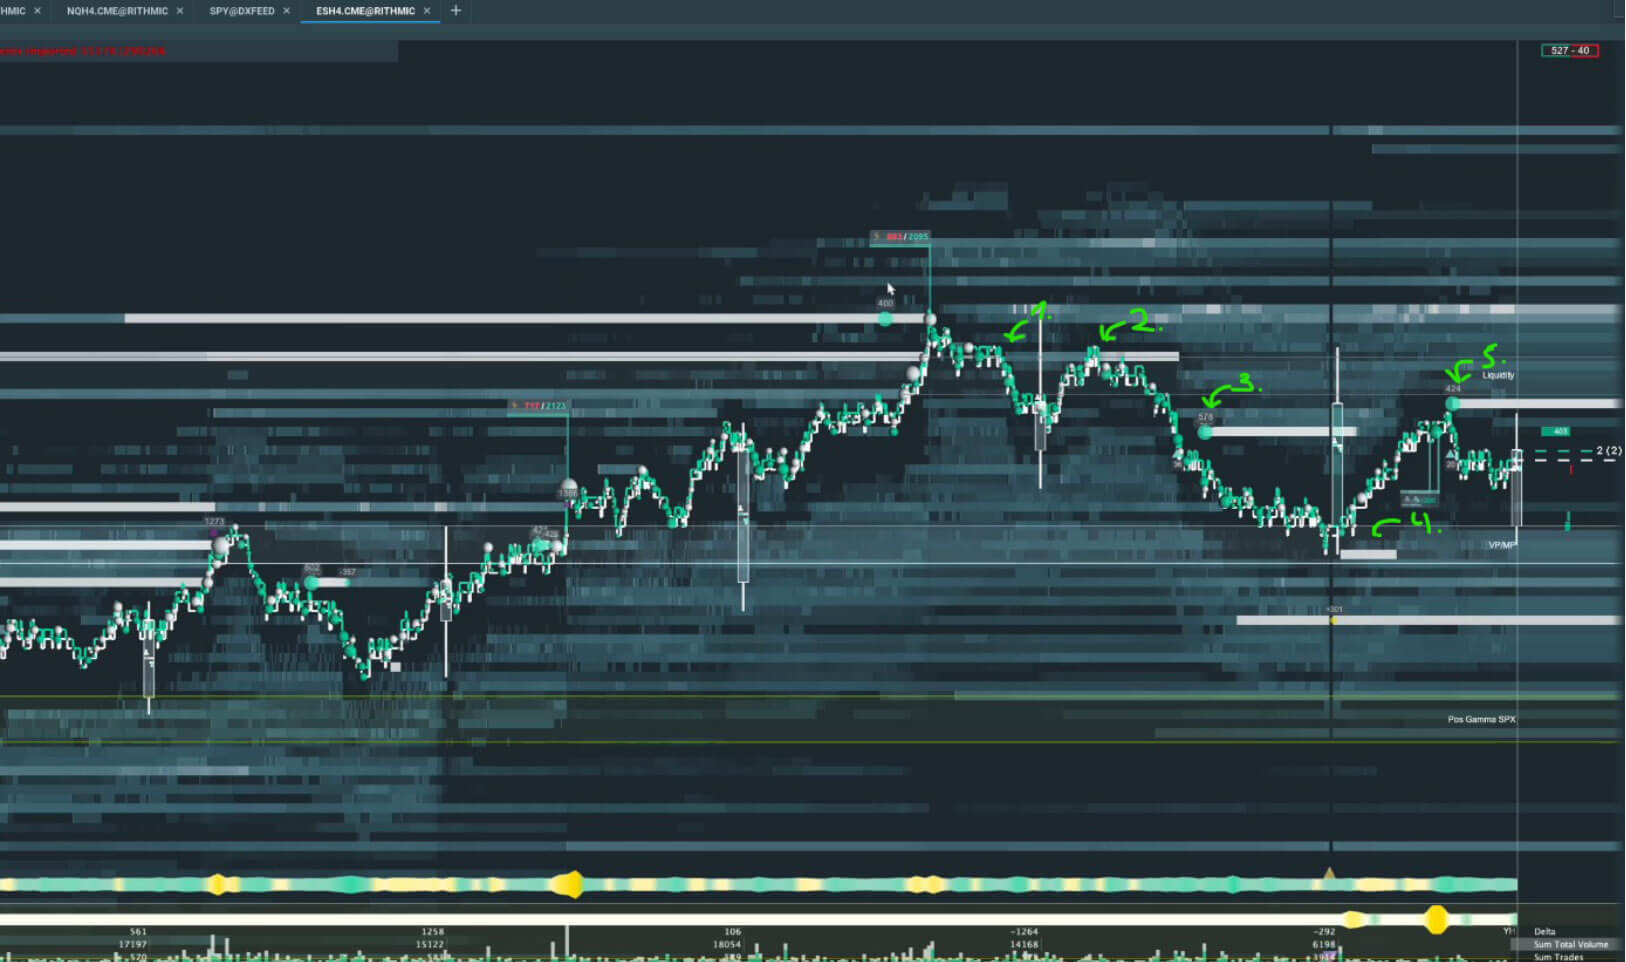
A large displayed quantity may appear close to price and disappear before price reaches it. Legitimate changes or cancellations can explain that. Spoofing, by contrast, involves placing an order with the intent to cancel it before execution and create a false impression. A single heatmap cannot establish that intent.

Historical heatmap chart with marked areas of displayed liquidity along the price path.
Heatmap labelled “spoofing” in a screenshot from 2025. Visible traces and cancellations may justify further investigation; this image does not prove deceptive intent. Image: TradeNeon.

When large orders appear briefly and vanish, start with what you can observe: time, price level, displayed size and whether a trade occurred. Then check whether the pattern repeats and how price responds. Even repetition does not prove deceptive intent. Unreliable displayed depth may matter to your trading decision without accusing another participant of unlawful conduct.

CME describes spoofing in terms of intent when placing an order. Careful language matters in your analysis: you can observe displayed liquidity arriving or disappearing without knowing the motive.

06

Using order flow in your trading routine

That is a lot to take in. A calm sequence helps: first choose your market and a relevant level. Write down what would support your thesis, what would challenge it and when you would stay out. Then observe executions, displayed orders and the price response. A striking colour or number becomes an observation you can test.

Order flow takes practice because one pattern rarely has only one interpretation. Absorption need not end in a reversal; a sweep does not identify a trader; a disappearing order does not prove deception. The question is whether what you observe at a level you selected beforehand fits a sound plan.

Level of Interest helps identify potential price areas for market analysis. It is not an order-flow display and cannot make a trading decision for you. If you want to explore the full process of market analysis, execution and risk management, TradeNeon's day-trading programme is currently available in German.

Which levels deserve a closer look?
Level of Interest helps you find potential price areas for analysis. You assess how the market trades when it reaches them.
Explore Level of Interest
Bull and bear – the TradeNeon characters for Level of Interest
Frequently asked questions
What is order flow in trading?

Order flow concerns a market's changing orders and executions. Depending on your data feed, you may see displayed limit orders, traded volume and how they change over time.

Does order flow tell me why price rises?

It adds observations about market activity. It cannot unambiguously reveal a particular trader's motive or the cause of every price move.

Is a large order in the book always important?

No. It can be changed or cancelled and might never execute. Assess it together with actual trades and the price response.

Can I identify spoofing with certainty in a heatmap?

No. Repeatedly disappearing orders can prompt questions, but a single view cannot establish the deceptive intent required for spoofing.

Simon Reichert
Simon Reichert
TradeNeon
Simon Reichert works on market analysis and trading education at TradeNeon.
Fibonacci in Trading: Method, Not Magic

Fibonacci in Trading: Method, Not Magic

Anonymous suited figure holding an illuminated metal spiral above staggered dark steps.
Swing tradingChart analysis

Fibonacci in trading:
Method, not magic

Fibonacci lines express an observed price move in percentages. They can help you mark areas where a pullback may deserve attention. The sequence cannot tell you whether the market will react there. Your chosen swing, market context and risk plan still matter.

A spiral illustrates proportions; it cannot forecast the next price.Image: TradeNeon

Fibonacci sounds like a name from an old book of spells. Behind it is a number sequence that has interested mathematicians for centuries and is also used in trading.

Anyone looking at chartsVisual representations of prices over time, such as line or candlestick charts. will eventually encounter horizontal lines at 38.2% or 61.8%. They look precise and are intended to show possible pullbacks within a price move. But where do these numbers come from? And what can a line really tell you about the next trade?

This article explains how the Fibonacci sequence works, which tools have been built from it and how to use a Fibonacci retracementA Fibonacci retracement divides a selected price move between a high and low into percentage pullback levels. on a chart. The original chart examples show both the choice of a trend move and common mistakes. The mathematical ratios are clear; whether price reacts at a level is a separate question.

The main point

A Fibonacci retracement measures how far price has moved back through a selected earlier move. Its lines are areas to observe, not support levels that work automatically or trading signals on their own.

01

The Fibonacci sequence

The Fibonacci sequence begins 0, 1, 1, 2, 3, 5, 8, 13, 21. From the third term on, each number is the sum of its two predecessors: 3 + 5 = 8, followed by 5 + 8 = 13. Leonardo of Pisa, known as Fibonacci, popularised the sequence in Europe in his 1202 book “Liber Abaci”. The idea had been described earlier in India.

The number sequenceEach number grows from the two before it
Animated line chart of the Fibonacci sequenceIndices 0 through 9: 0, 1, 1, 2, 3, 5, 8, 13, 21, 34. From the third term onwards, each value is the sum of the two before it. 05132134 0123456789 0112358132134 Sequence value Index in the sequence Animated line chart of the Fibonacci sequenceIndices 0 through 9: 0, 1, 1, 2, 3, 5, 8, 13, 21, 34. From the third term onwards, each value is the sum of the two before it. 05132134 0123456789 0112358132134 Sequence value Index in the sequence
Select a step
Calculation 913 + 21 = 34Fn = Fn−1 + Fn−2 · n ≥ 2
Redrawn from the values in the Academy diagram. The rising curve shows the number sequence, not a price chart.

The ratios become interesting: 3 divided by 2 is 1.5; 5 divided by 3 is about 1.667; 8 divided by 5 is 1.6, and 13 divided by 8 is 1.625. Farther along the sequence, the ratio of consecutive numbers approaches the golden ratio, about 1.618. Reverse the ratio and you obtain about 0.618. Numbers two or three positions apart produce approximately 0.382 and 0.236. That is the mathematical origin of the familiar percentage levels.

A spiral can be drawn from adjoining squares and quarter circles. Similar shapes occur in some shells and plants. The drawing illustrates proportions. It does not show that every natural spiral follows the golden ratio exactly or that market prices obey it.

Geometric Fibonacci spiral made from squaresSquares with side lengths 13, 8, 5, 3, 2, 1 and 1. Quarter-circle arcs within the squares form an approximate spiral.
New geometric construction: Fibonacci squares and quarter circles form an approximation.
New photographic depiction of a cutaway nautilus shell with visible chambers and an organic spiral against a dark background.
New shell illustration: an organic spiral for context, not proof of an exact Fibonacci ratio in nature.
02

What a retracement measures

Many traders use these ratios as a grid for corrections within a trend. A retracement tool connects a selected low and high, or the other way around, and divides the price range into percentages. After a rise from 100 to 120, a 50% pullback lies at 110; a 61.8% pullback at 107.64. These levels describe distance from the high. The calculation cannot tell you whether price will reach or reverse at either one.

23.6%Ratio from the sequence
38.2%Ratio from the sequence
50%Half the move; not a Fibonacci ratio
61.8%Reciprocal of the golden ratio
78.6%Approx. √0.618; a charting convention

50% is half the move, but is not a ratio from the Fibonacci sequence. Some traders add 75% as another round number. The 78.6% level is approximately the square root of 0.618 and has become a convention in many charting tools. So 75% and 78.6% are different; neither is automatically the “last” valid pullback before a trend breaks. Which lines a platform displays depends on its settings.

What do the lines mean in practice? In an uptrend, a 23.6% retracement describes a shallow pullback, 38.2% a larger one and 61.8% a deeper one. This tells you only how much of the selected move price has given back. It says nothing about the strength of the trend or the chance that it will continue. Change the starting point and the prices of all percentage levels change too.

Retracement levels from the original diagram0: 1.16660; 0.382: 1.15465; 0.5: 1.15095; 0.618: 1.14725; 0.75: 1.14310; 1: 1.13525 Pullback between two price anchors Ratio Price 01.166600.3821.154650.51.150950.6181.147250.751.1431011.13525 Retracement levels from the original diagram0: 1.16660; 0.382: 1.15465; 0.5: 1.15095; 0.618: 1.14725; 0.75: 1.14310; 1: 1.13525 Retracement Ratio Price 01.166600.3821.154650.51.150950.6181.147250.751.1431011.13525
Redrawn from the original diagram. The lines show distances between two selected price anchors; the prices reproduce the rounded labels in the historical screenshot.

The earlier “league system” ranked 61.8%, 38.2% and 23.6% by presumed attention. That does not establish a ranking of how prices react. Nor is there evidence that institutional traders or algorithms generally cause higher volume at these levels. A commonly watched area may be part of a market observation; its hit rate and practical value have to be tested for the market and rules in question.

Sometimes a response at a widely watched level is explained as a self-fulfilling prophecy. To support that explanation, we would need to know how many participants chose the same trend leg, settings and trading direction. Even 75% and 78.6% produce different prices. An earlier high, news or liquidity may also be nearby. A price response close to a Fibonacci line cannot, on its own, identify what caused it.

Keep mathematics and market behaviour separate

The origins of 61.8%, 38.2% and 23.6% can be calculated. The claim that these particular lines hold more often or cause reversals is an empirical one. It does not follow from the sequence.

TradingView describes the calculation from two extreme points; CME explains retracements and extensions as technical-analysis tools.

03

Retracements, extensions and time zones

The retracement is the central Fibonacci tool. You select a high and low on the chart; the platform draws the chosen percentage levels between them. In an uptrend, that usually means a move from low to high, and the reverse in a downtrend. You can often adjust the lines yourself. They mark areas worth watching, not entries at the press of a button.

Extensions project arithmetic levels beyond the original high or low. Common examples are 161.8%, 261.8% and 423.6%, each relative to a selected prior move. Traders use them, for example, to assess possible target areas after a breakout. An extension is not a price target with a known probability.

Fibonacci time zones transfer distances from the sequence to the time axis rather than price. They can mark windows to observe, but do not predict a turning point. One retracement is usually enough to learn the method: decide in advance which move you are measuring and why its high and low fit your approach. Move the anchors later and every line changes.

04

Assessing an area on your chart

Step 1: Identify the trend. Before drawing levels, check whether the market shows a recognisable move followed by a correction. Without a justified trend leg, almost any two highs and lows can produce a grid. Record the period and market phase you are examining.

Step 2: Connect two points. In an uptrend, draw from low to high; in a downtrend, from high to low. The original article included candle wicks when choosing the extremes. Select prominent points that were visible before the potential reaction, and check how your platform displays the percentages.

Step 3: Watch the response. As price approaches an area, you can examine price behaviour, market structure and volume. An existing support or resistance areaA price area where buying or selling was previously visible. It may matter again, but does not have to., a volume profileDisplays traded volume by price area rather than by time. It records past activity, not guaranteed future support. or order flow may add context. Higher volume at a line does not prove that the Fibonacci number caused it.

The Academy original also mentioned auction speed and order-flow signals as possible observations. They can describe current trading activity. They do not replace a rule for recognising a response: Is a touch enough, must a candle close, or should another price area confirm the move? Without that definition, the desired outcome can easily influence a later review.

Step 4: Decide how to act. Only a rule defined beforehand determines whether the observation becomes a trade: What confirms the idea, what invalidates it, where is the stop and how large may the position be? A stop orderAn order triggered when a chosen price threshold is reached. In fast markets, execution can differ from the trigger price. and appropriate position size belong in that plan. A line alone is not a confirming signal.

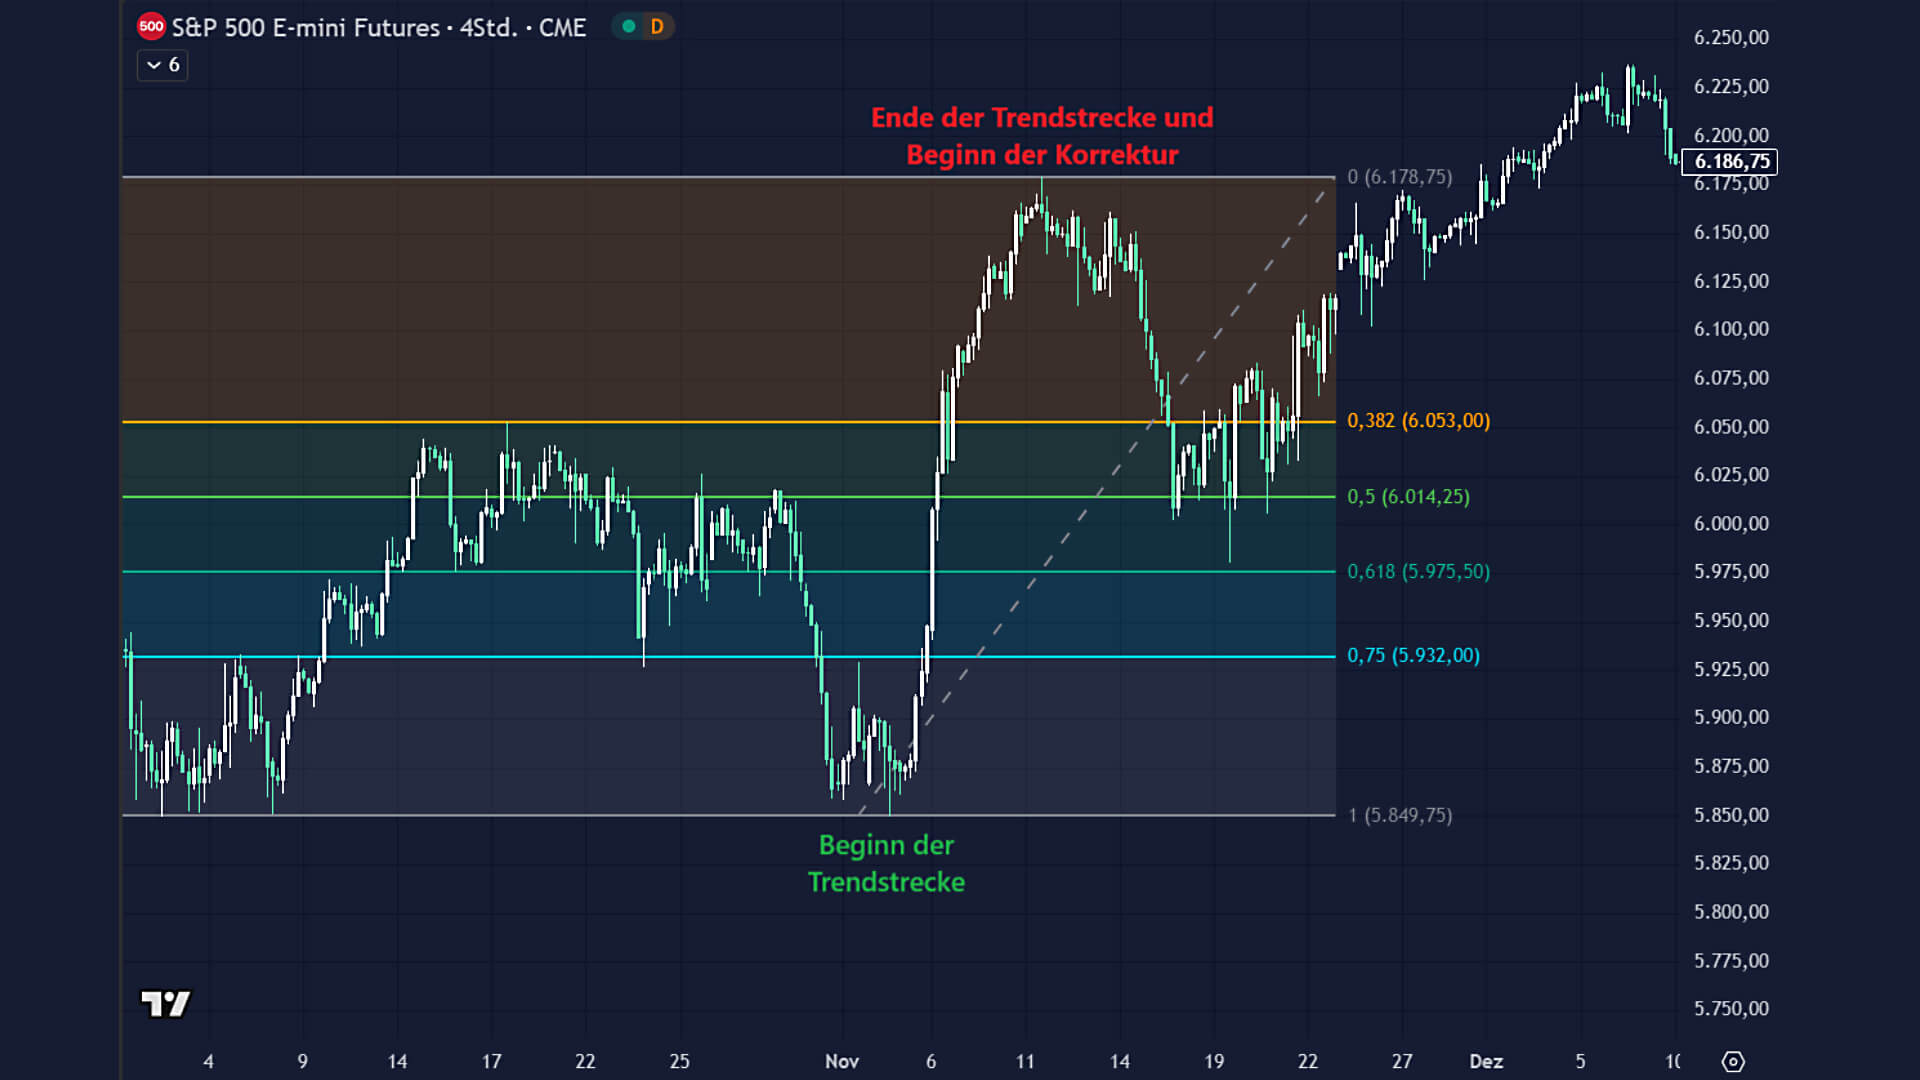
The original example shows the S&P 500 E-mini future (ES) in 2024. After a rise, a low at 5,849.75 and a high at 6,178.75 were connected. The earlier body text said 6,178.85, while the chart itself labels 6,178.75. The correction first touched areas around 38.2% and 50%, then price rose again. That is the sequence in this historical snapshot, not proof that these levels work in general.

Original S&P 500 E-mini futures chart with anchors at 5,849.75 and 6,178.75, retracement levels of 38.2, 50, 61.8 and 75 percent, and subsequent price action. German chart labels mark the start and end of the trend move.
Original example: ES, 2024. The German labels identify the start and end of the trend move. The later price path helps explain the anchor choice. Open the image for full size.

Why choose that low? It formed after a decline and a short sideways phase. Price then broke upwards quickly; the area had also been visible several times in October. Those are intelligible reasons for the anchor. The image cannot tell us whether everyone would have chosen the same low beforehand. Selecting the range only after seeing the subsequent reaction turns a fit in hindsight into a false forecast.

The high was a prominent extreme in the period shown. The low, by contrast, was an interim low within the larger uptrend. That is why the reasoning behind both anchors matters more than how neatly the lines appear on the chart. Another defensible start to the move would have produced different retracement prices. The image shows how to discuss a choice; it cannot settle it once and for all.

05

Three common mistakes

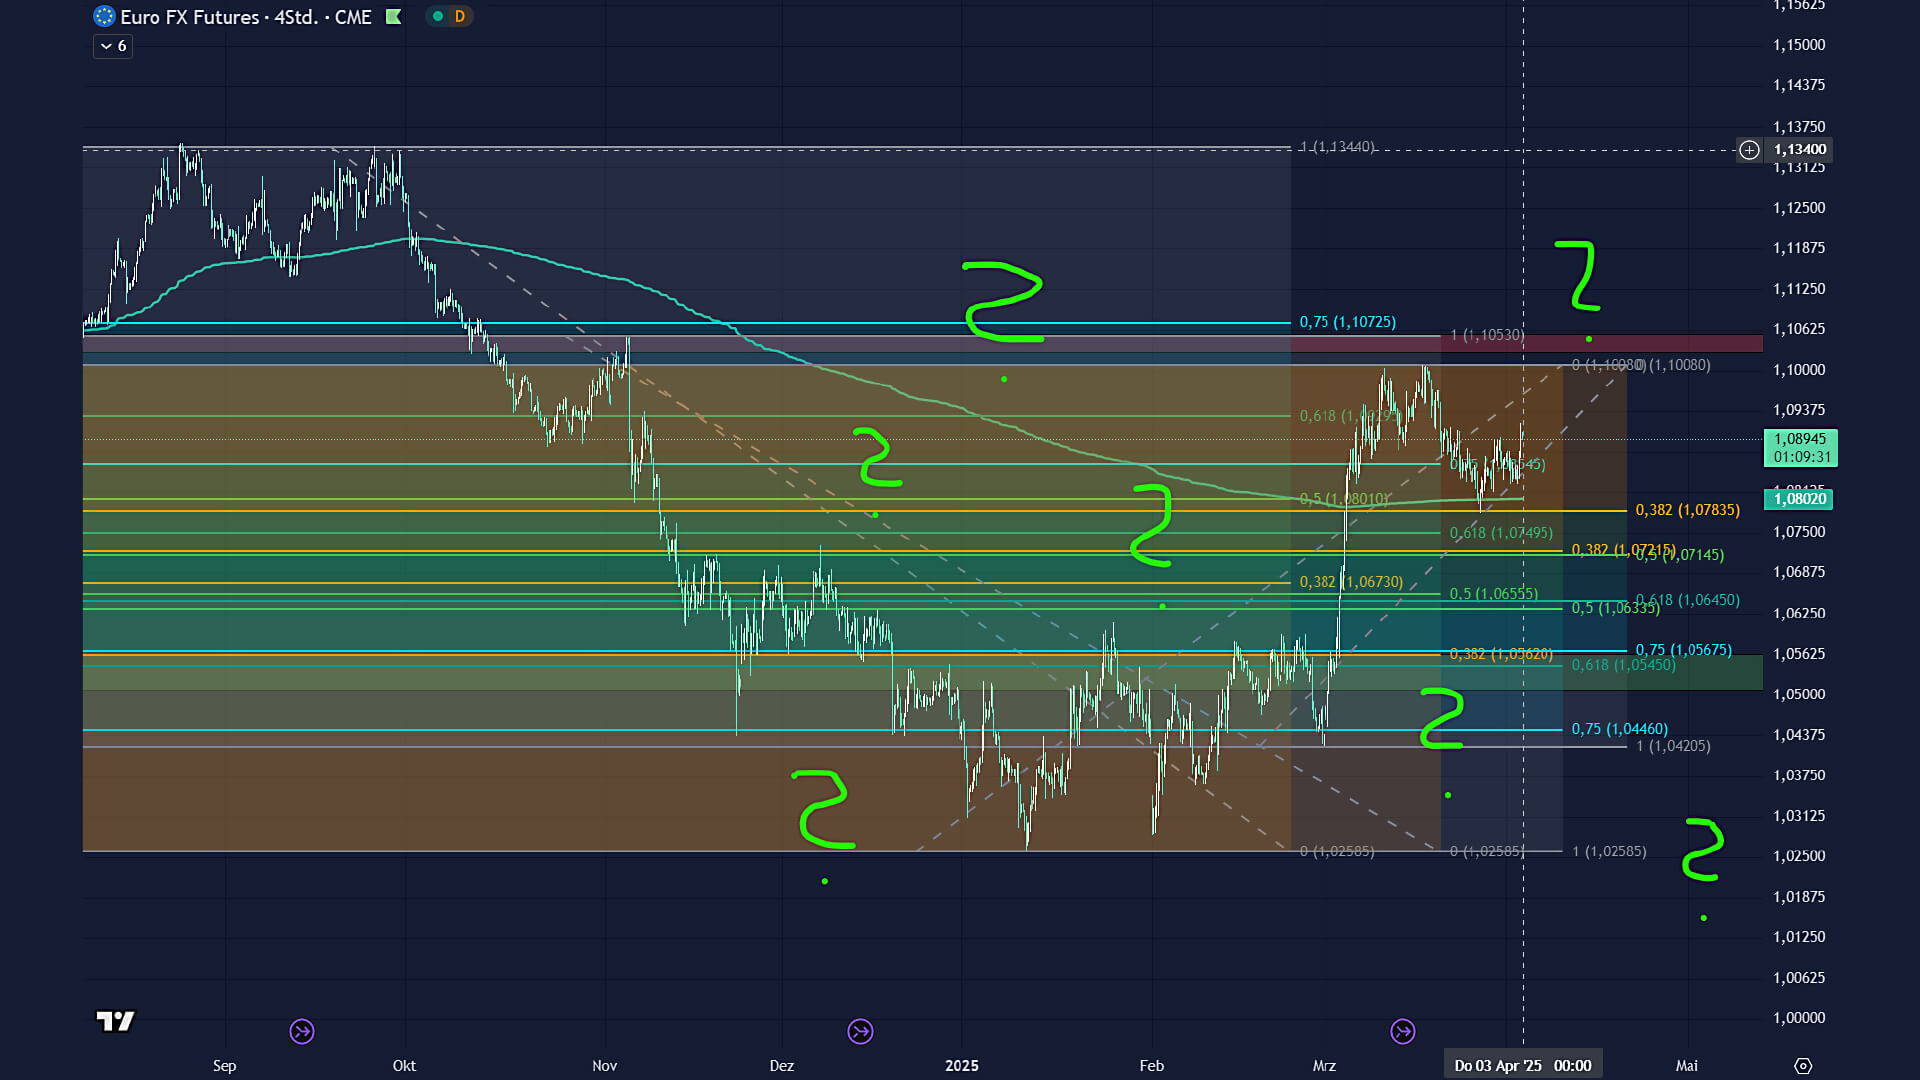
Mistake 1: Too many retracements. Measuring different moves and timeframes at once creates a tangle of lines. Some level will almost always be near the current price. The original Euro FX futures image shows just that overlap: several coloured grids and numerous possible “hits”. For an analysis you can assess, focus on one or two justified moves.

Original Euro FX futures chart with many overlapping Fibonacci grids and green question marks; the lines are difficult to attribute to one move.
Original example: too many grids. Overlap makes a hindsight match easy; it does not provide a forecast. Open the image for full size.

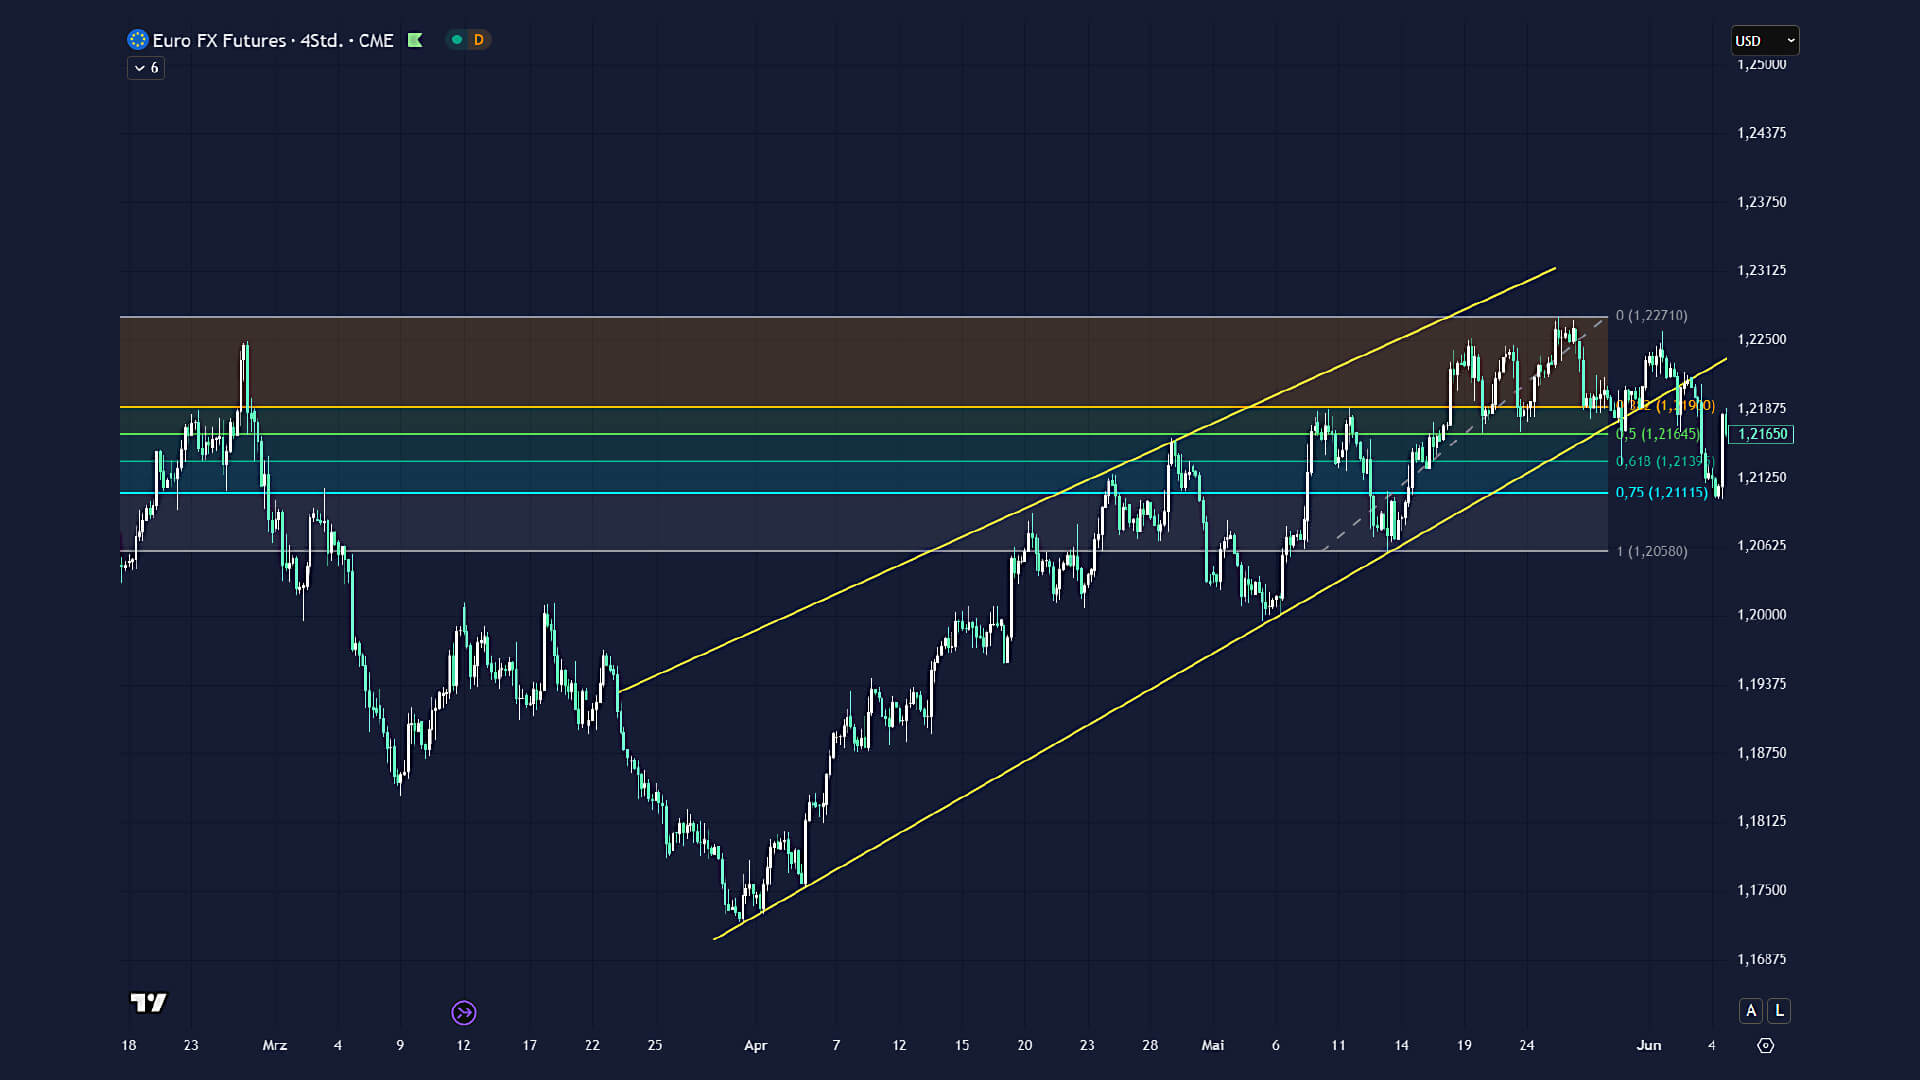
Mistake 2: Unclear highs and lows. A retracement always measures only the range you select. Small interim moves produce different lines from a prominent swing. The second Euro FX futures image shows a single grid within a longer price history. It invites the question of whether the chosen points fit the move under study. Clear selection rules recorded beforehand matter more than an apparently perfect match in hindsight.

That does not mean there can be only one permissible high and low on an entire chart. Different timeframes may justify different trend legs. Keep them distinct, though: Which question does the daily chart answer, and which the four-hour chart? Changing the timeframe after a losing trade can let a fresh grid hide the mistake rather than explain it.

Original Euro FX futures chart with one Fibonacci grid inside a larger uptrend and yellow trend lines.
Original example: anchor choice. Check which move the grid actually measures. Open the image for full size.

Mistake 3: Relying on Fibonacci alone. A touch of 61.8% is not a complete trading decision. Check whether market structure and other observations fit the idea, and define entry, invalidation, exit and risk. Even a confluence of indicators is not yet a demonstrated edge. Only an evaluation of many cases traded under the same rules can show whether a method holds up.

06

Where Fibonacci fits in a trading method

Fibonacci is no miracle cure and no system that does the work for you. It can help you describe a price move deliberately: Where did it start, where did it end, and how deep was the correction? Above all, the method makes you state your chosen anchors and areas of interest openly.

That makes it useful as part of an analysis. It does not turn possible reversal areas into predictable turning points. A pullback may touch a line, move through it or turn before reaching it. You see the market's response only as it develops. Swing tradingAn approach in which positions are commonly held for several days to weeks to participate in medium-term price moves. offers a longer timeframe for this observation, but no automatic advantage from Fibonacci.

If you want to develop your own approach, define in advance which market phase, trend leg and confirmation you seek. Record when the idea would be invalidated, too. Then review losing trades, costs and different market phases. That lets you examine whether a rule is repeatable instead of collecting only charts that worked out.

In its swing-trading programme, TradeNeon places retracements in a specific Fibonacci system for futures and a wider process of market analysis, system rules and risk management. Other trading approaches exist as well; there is no universal single system. The complete process matters more than one percentage line. The programme is currently offered in German.

Swing trading programme
From chart to trading routine
Explore how TradeNeon brings analysis, rules and risk management together. The programme is currently available in German.
View swing-trading programme
Oliver Sparing, Head of Trading at TradeNeon
Frequently asked questions
What does 61.8% mean in Fibonacci trading?

It is approximately the reciprocal of the golden ratio. In a retracement, it marks 61.8% of the chosen earlier price move. It is neither a reliable turning point nor an entry signal.

Is 50% part of the Fibonacci sequence?

No. Half the move is a commonly added chart level, but not a ratio derived from the sequence.

Are 75% and 78.6% the same?

No. The latter comes from the square root of 0.618; 75% is a separately added level. Any level used should belong to a method defined beforehand.

Can I trade from Fibonacci lines alone?

A line only locates a point within a past price move. You still need rules for context, entry, invalidation, exit and risk.

Simon Reichert
Simon Reichert
TradeNeon
Simon Reichert works on market analysis and trading education at TradeNeon.
Investing vs. Speculating: Beauty and the Beast of Markets

Investing vs. Speculating: Beauty and the Beast of Markets

A suited woman holds a plant while a suited beast-like figure studies a trading chart opposite her.
Investing & tradingPerspective

Investing vs. speculating:
beauty & beast?

Investing sounds prudent; speculation sounds dangerous. Yet a long time horizon does not make a decision sound by itself, and a short one does not make it foolish. Your goal, your reasoning and the risk you actually take matter more.

The plant and chart stand for two approaches, neither of which guarantees an outcome.Image: TradeNeon

Two ways into a market.
Both require judgement.
What the terms mean, where they overlap and how to assess their risks.
Show contents

Whether you are new to markets or have years of experience, you will have heard the words “investing” and “speculating”. It often seems obvious which sounds better. I felt the same, although I do both. So let me start with a question: Which sounds more positive to you, “I invest in the market” or “I speculate in the market”?

Investing may bring patience and foresight to mind; speculating may suggest bets and quick gains. That difference in how the words sound is where this article begins. It says little about how someone actually makes decisions or what risk they take. Let us look at the terms, their place in market history and, finally, the question of when a trading idea amounts to more than hope.

The key distinction

Investing and speculating are not moral opposites. An investment usually centres on a longer-term goal and the development of an asset; speculation centres more strongly on an expected price move. Either can be thoughtful or careless. Both can lose money.

01

Two terms, no fixed boxes

Why does one word sound so much more reassuring? In everyday language, to invest is to devote money, time or effort to something. It suggests building for the future. By contrast, the German verb for “speculate” can mean either to expect something or to conjecture, as the Duden dictionary shows. One meaning sounds calculated, the other uncertain. Language helps explain the reputation.

Public images differ too. Investors are often portrayed as patient thinkers who support businesses, while speculators appear as gamblers who drive prices. Both images simplify reality. Holding an asset for years does not show whether the purchase was well reasoned; a short-term position need not be impulsive.

If you hold a stock for years, you may be investing in the future of its business. If you buy the same stock because you expect a short-term move, your decision is closer to speculation. The instrument does not settle the question; your time horizon, reasoning and risk plan say more.

The boundary remains blurred. Long-term investors also form expectations about the future, while traders may base their decisions on data and defined rules. These labels help explain an approach; they do not assess any individual trade for you.

02

Beauty: investing for a longer goal

Woman in a dark suit tends a plant while reading a notebook.
The plant represents a long planning horizon, not assured growth. Image: TradeNeon

For a longer-term investment, ask what the money is meant to accomplish, how long it can remain invested and which fluctuations you can tolerate without abandoning your plan at a difficult moment.

DiversificationSpreading capital across different investments to reduce the impact of a single holding. Losses remain possible. can limit exposure to one company or market. It cannot remove general market risk or prevent all losses. The SEC's investor guide to time horizon and diversification treats both as starting points for an investment decision.

“Long term” is no safety guarantee. A concentrated stock position, an unsuitable time horizon or borrowed money can make a supposed investment highly risky.

03

The beast: speculating on price

The Latin speculari means to watch or observe. The word's origin is a reminder that speculation can involve observation and a view of what may happen next. Etymology does not show that every present-day trade is carefully analysed. A market view can be built on evidence or simply guessed.

Beast-like figure in a dark suit studies a trading chart beside a closed notebook.
A market view also needs a plan for the possibility that it is wrong. Image: TradeNeon

SpeculationSpeculation is buying or selling an asset because you expect its price to change. makes an expected price change central to the decision. The horizon may be short or longer. A trade needs a clear thesis, rules for entry and exit, and a controlled position size.

Take particular care with leverageBorrowing or derivatives allow a larger market exposure than the capital committed. Gains and losses can both be amplified.. The SEC's investor bulletin explains why leveraged positions can carry substantial additional risk.

Reasoned speculation is no promise of profit. Without rules, a trade can turn into wishful thinking; with rules, mistakes and losses remain possible.

04

What speculation can do for markets

Why, then, does speculation have a poor reputation? Exuberant expectations and buying with borrowed money played a part before the 1929 stock market crash. The boom of the 1920s attracted more investors, some of whom paid for only a small share of their stocks with their own funds. When prices fell, debt increased the pressure. Yet the crash and the Great Depression had several causes. Neither speculators nor a single emotion can explain them on their own.

In futures markets, speculators may take the other side of positions that commercial participants want for hedging. They can thus contribute to market liquidityMarket liquidity describes how easily an instrument can be traded without one order moving its price sharply. and price discovery. That does not mean every speculative trade makes prices stable. The US futures regulator discusses both their contribution and the limits of that claim.

A village market makes the possible effect easier to picture. Three sellers offer identical cartons of eggs for three, five and seven euros. Once the cheapest cartons sell out, buyers face a sharp jump to the next price. If more sellers offer cartons at prices in between, buyers see more choice and smaller gaps between offers. In financial markets, additional buy and sell orders can likewise make trading easier. But the example does not prove lasting price stability. In a panic, many participants may rush to the same side at once.

For commodities such as oil or wheat, the need for counterparties is especially clear. Producers and users hedge against price changes; speculators can take the other side of those trades. Whether a particular market is calmer as a result depends on supply, demand, market structure and participant behaviour.

The 1929 crash shows the danger of excess and borrowed money. From its September 1929 high to July 1932, the Dow Jones fell about 89% – not within a few weeks. Causes and consequences reached far beyond the decisions of individual speculators. Federal Reserve History documents the timeline.

The economic consequences were severe: banks came under pressure, credit tightened and unemployment rose. Responses to financial crises later included deposit insurance and stronger requirements for banks. These measures emerged at different times and for different reasons; they are not a single set of immediate responses to the October crash.

Market-wide circuit breakers were not an immediate response to 1929, either. The coordinated US trading-halt rules followed the crash of 1987, according to the SEC.

05

Do rules make speculation predictable?

Can speculative trading amount to more than gambling? A trade without a reasoned thesis, limited risk or a plan for being wrong resembles a wager. A planned trade can instead be examined. That does not mean it will win, or that rules alone create an edge.

A system can make decisions comparable and open to review. The efficient-market hypothesisThe efficient-market hypothesis examines how available information is incorporated into market prices. is a reminder of how difficult a lasting edge may be. It is not a claim that every active approach must fail. Fama's research review distinguishes different information sets and tests.

Even a comparison with an index demands care. Beating a broad stock index over a short period may be luck. Longer records must also account for risks, costs and a suitable benchmark. The efficient-market hypothesis provides a framework for such tests. It is neither a mathematical proof that every trader must fail nor a licence to assume that one's own method is an exception.

A backtestApplying predefined trading rules to historical data. A good historical result does not prove future profits. can show how rules would have behaved in past data. Hindsight, overfitting and omitted trading costs can distort it. Testing in a demo account adds observations, but does not reproduce real execution under financial risk. The CFTC specifically warns about hypothetical results.

Backtesting and forward testing are two different stages: first examine predefined rules against historical data, then observe them on new data or in a demo account. The key is not to rewrite the rules after each poor result and then present the revised backtest as an independent test. Even a favourable result provides clues, not a reliable forecast for your own account.

In their 2007 review, Park and Irwin found 56 positive, 20 negative and 19 mixed results among 95 more recent studies of technical trading strategies. That is one reason why a blanket “it never works” is too simple. The authors also discuss problems including data selection and differences in methods. The studies examine different markets and strategies. They do not show that a particular course, trader or reader will outperform a benchmark in future.

The newer data-driven strategies mentioned in the original are not recipes that transfer directly to an individual account. Some research assumes data, infrastructure or execution that retail traders do not have. Isolated examples and monthly returns without an appropriate comparison can distort expectations. To judge a method, ask for a complete record, costs, losing periods and practical feasibility.

A test, not a promise

Ask which data were available before a trade, how costs and losing periods were counted, and when the method would be rejected. One compelling example is no substitute for a reliable record.

06

Which approach serves your goal?

Is speculation the beast of the market, then? The answer depends on the behaviour you mean. Overconfidence, heavy borrowing and decisions made in panic can cause harm. Observation, a plan that can be tested and limited risk can provide a basis for a trade. Even then, the outcome remains uncertain. A systematic method does not become profitable merely because it has rules.

Investing and speculating are therefore not moral roles you must choose between once and for all. Both involve an uncertain future. They often differ in what you expect to happen, how long you commit capital and what work a decision requires. Someone seeking to build wealth over many years asks different questions from someone trading a particular price move.

Investing

Question: What should this capital accomplish over a longer period?

Work: Define your goal and horizon, diversify and review the plan.

Risk: Price swings, losses and unsuitable choices of asset or timing.

Speculating

Question: Which price move do I expect, and what would invalidate the idea?

Work: Analyse the market, set trading rules, document decisions and manage risk.

Risk: Losing trades, costs, execution problems and amplified losses with leverage.

You do not have to choose a character. Long-term investing and active trading can serve different purposes. Treat each with its own goal, suitable capital and a plan you can test.

Perhaps “I speculate” now sounds less like a synonym for gambling, while “I invest” sounds less like a guarantee of safety. The label cannot protect you from a mistake. Ask instead: Why am I taking this position? What would invalidate my reasoning? What loss could I bear? That turns the picture of beauty and beast into a concrete market decision.

TradeNeon Academy
Explore the learning paths
From stocks and ETFs to structured trading education: compare the content and requirements at your own pace. Programmes are currently offered in German.
View courses and programmes
Frequently asked questions
Is investing always safer than speculating?

No. Holding an asset for longer does not remove market risk or the risk of an unsuitable investment. The type and duration of the risk often differ.

Is speculation the same as gambling?

Not necessarily. A reasoned market view with defined rules differs from a random bet, although it cannot secure a profit.

Does a backtest prove a strategy works?

No. It only models a result on past data. Rule selection, costs and future market conditions may change the real outcome.

Can I invest and trade?

Yes, provided you plan their purposes, capital and risks separately and can bear the financial consequences.

Simon Reichert
Simon Reichert
TradeNeon
Simon Reichert works on market analysis and trading education at TradeNeon.
Which Trading Style Fits Your Life?

Which Trading Style Fits Your Life?

A compass-headed figure stands where three different paths begin.
TradingOrientation

Which trading style
fits your life?

Swing trading and day trading differ mainly in their trading horizons. Options are instruments you can use in either approach. The question is which schedule, risks and learning commitment fit your life.

The compass represents a choice of approach and instrument. None of the paths guarantees a result.Image: TradeNeon

Your schedule sets the pace.
Risk belongs in the decision.
Six criteria help you compare trading styles and instruments without relying on promises.
Show contents

Finding your way into trading starts with orientation. You may want an activity alongside your job, or you may want to spend more time studying the markets. Before choosing an approach, ask how much time you can devote to learning and trading, and what loss you could afford to bear.

The original Academy article places scalping, day trading, swing trading, position trading and long-term investing along different time horizons. That is a useful map: shorter trades often call for faster decisions. How demanding an approach really is also depends on the instrument, your rules and your preparation. OptionsOptions are time-limited contracts on an underlying asset. Buyers pay a premium for the right to buy or sell at a set price; sellers take on the corresponding obligation. are not another holding period. They can be used for short-term or longer-term positions.

The point to remember

A shorter trade is not automatically riskier, and a longer one is not automatically safer. There is no universal starting capital or dependable return range for a trading style. Compare your available time, ability to bear losses, product knowledge and entry and exit rules.

01

The role of education

Trading is a craft that takes time to learn. Information is abundant. The harder part is judging whether it is accurate, what you need to learn first, and whether a system shown online fits your life. Videos can provide a starting point, but they cannot replace practice or a method you understand.

In the Academy original, Simon describes trying out systems promoted online in a demo account without finding a sustainable approach. His experience does not discredit all free learning resources. It shows why you should test a system before putting money at risk: What market logic supports it? How are losses managed? Are difficult periods discussed as well?

If you are considering training, get to know the people and their teaching first. A reputable provider gives you material that lets you judge the depth of its teaching, its treatment of risk and its teaching style. Even with guidance, you still need time to learn, test and practise your decisions. That applies to every approach below.

ScalpingScalping is a very short-term trading approach in which positions are often held for only seconds or minutes. often takes place within seconds or minutes. In day tradingIn day trading, positions are opened and closed within the same trading day., you close positions within the same session. Swing tradingSwing trading means holding positions for several days or weeks to capture an anticipated price move. allows an idea to develop across sessions; position tradingPosition trading means holding trading positions for weeks or months based on a longer-term market thesis. follows a longer-term market thesis. These boundaries provide orientation, not a guarantee of workload or results.

02

How much time can you devote?

Assess the time you have on an ordinary working day. Trading has to fit more than an ideal schedule. You need time for preparation, learning and review as well as the trade itself. Asking only how long a trade takes misses much of the work.

Day trading requires you to make focused decisions and monitor orders during your trading window. Hours spent are not a badge of quality: an hour without preparation may be insufficient, while a clearly bounded window can be part of a considered routine. The US investor education site emphasizes the risks of short trading intervals.

Swing traders often check the market and their open positions once a day. That can make a planned routine possible alongside work. The 15 minutes mentioned in the original are not a general promise: finding setups, preparing orders and reacting to news may take longer. TradeNeon’s swing trading programme describes roughly 30 minutes of daily routine; learning may take longer.

Day trading calls for focused attention during a defined trading window. That does not necessarily mean eight hours at a screen. An hour may be enough for an experienced trader with a prepared plan; it may not be enough for learning, reviewing trades or every market day. The day trading programme is aimed at people who can devote one to three hours per day to trading. These figures describe the programmes, not every trader. Both programmes are currently offered in German.

For options, the particular strategy determines the time needed. A position running for several weeks requires different checks from a 0DTE option0DTE options are option contracts that expire on the trading day. on expiration day. A short life can demand close attention and quick decisions; it does not promise a higher return.

03

Which holding period fits?

Your holding period affects how long capital is tied up and when positions need attention. The Academy original describes swing trades that often run for five to 60 days. That describes its approach, not a fixed definition. Some positions end sooner; others call for more patience. Open positions remain exposed to news and price gaps overnight or over a weekend.

In day trading, you open and close a position within the same trading day. You avoid a planned overnight position. Prices can still move sharply during the session, and decisions and orders require active attention. No planned overnight exposure does not mean no risk.

Options have expiration dates, but using one does not define your trading style. An option held for longer may form part of a swing trading strategy; one opened and closed within a day may form part of day trading. The original's examples of 30 to 45 days for some income strategies and 0DTE at expiration are different lifetimes, not a third discipline between day and swing trading.

04

Which capital can you afford to risk?

A blanket figure such as “€5,000 for day trading” or “€10,000 for swing trading” is not a market standard. Capital needs depend on the instrument, contract size, costs, potential loss and position size. Money needed for living expenses and essential reserves should not be put at risk.

Keep trading capital separate from money for ongoing costs and long-term goals. The original article recommends treating long-term investments separately from active trades. That helps you avoid covering a trading loss with money needed elsewhere.

A small margin requirement is not the same as a small maximum loss. With leveraged products, the important question is how a market move affects your account. Our position sizing and risk management article shows how to work through this before a trade.

In swing trading, a stop placed farther from entry can put more money at risk per unit. A smaller position or another instrument can change the risk per trade. In day trading, a shorter price move may mean a smaller loss per contract, but costs, leverage and an oversized position can outweigh that difference. External capital is no substitute for calculating your own risk.

There is no universal €5,000 or €30,000 entry point for options positions either. Buying or selling, coverage, contract size and possible margin calls make a substantial difference. A premium received is not money earned without risk.

Programme requirements, not blanket rules

TradeNeon’s current training pages give starting amounts of €3,000 for the swing trading stock systems, €10,000 for their options systems, and at least €5,000 of own capital for the day trading programme. These are programme-specific figures; they do not replace a review of your financial situation. The programmes are currently in German.

05

Which instruments suit you?

Swing trading can use stocks, futures or options, for example; depending on the approach, day trading may also use futures or options. An instrument is neither liquid nor suitable simply because of its name. Check the venue, contract terms, costs and the size of a potential loss.

The Academy article favours standardised exchange-traded products and warns about possible conflicts of interest in off-exchange transactions. The principle remains useful. Its blanket comparison of all CFDs, foreign-exchange transactions, certificates and warrants with exchange-traded products is too broad, however: terms and pricing need to be checked for each product and provider.

Buying an option gives you a time-limited right. Selling one creates an obligation. Potential losses depend strongly on whether you buy or sell, whether the position is covered, and the underlying asset. FINRA explains these differences; a premium received is not guaranteed profit.

With 0DTE options, price and risk can change rapidly before expiration. The Options Industry Council explains the mechanics and risks. A short expiration does not imply a higher chance of profit or less need to monitor the position.

TradeNeon’s former supported options trading course is not currently offered. This article therefore compares options as an instrument without pointing to an unavailable course. The current Lab of Trades options systems are linked in the box below.

Options in the Lab

Rules-based options systems

Argon presents the current options systems at Lab of Trades. Compare each strategy's requirements, costs and risks.

Explore Argon →
06

Which expectations are realistic?

The Academy original gives fixed annual return ranges for different approaches and even mentions results exceeding 100 percent. Those figures offer neither a dependable expectation for you nor a picture of possible losing periods. More risk does not automatically bring more return. The useful question is whether you understand a method's rules and can assess its results after costs and losses.

One account, system or backtestA backtest applies predefined trading rules to historical data. It does not demonstrate future profit. says little about what another person will achieve after costs and losing periods. Look beyond good months and ask about difficult periods and the size of interim losses.

Statistical options strategies in particular may go several weeks or months without a gain. A fixed set of rules does not remove every decision or prevent losses. In discretionary day or swing trading, judging the current market plays a larger role in your work. Ask what mistakes and losing streaks you would have to withstand with any approach.

07

Which risks fit your circumstances?

Trading should only involve capital whose loss would not threaten your living expenses. A demo account helps you learn processes and identify technical mistakes; it does not prove you will make the same decisions with real money. The market logic stressed in the original still matters: you should be able to explain why you enter a position, what would invalidate the idea and what loss you planned for beforehand.

LeverageLeverage uses borrowing or derivatives to create a larger market position than the capital committed. It can amplify gains and losses. does not make a strategy “capital efficient” in the sense of safer: it magnifies the effect of a market move. A planned stop expresses your intended loss limit, but a price gap or rapid execution can lead to a different fill. Before entering, assess what loss you can actually bear and how you would continue after a losing streak.

Losing trades cannot be ruled out. Position sizing, a risk limit and a record of your decisions can give your actions structure. They make risk more manageable without removing it. Whether a method suits you also depends on your ability to follow its rules through difficult market periods.

08

Find your way

The choice is not about picking a label. It depends on your daily life, finances and the way you make decisions. Take time to assess the trading horizons and the possible instruments separately.

  1. When can you watch markets and check orders regularly, not only on an ideal day?
  2. How long can capital remain tied up, and what happens after an overnight price gap?
  3. How much money is genuinely free after reserves and ongoing obligations?
  4. Do you understand contract value, costs, expiration and the instrument’s loss profile?
  5. What market thesis brings you in, and what would prove it wrong?
  6. How will you practise and document decisions before risking real capital?

If you want to study longer moves with a scheduled routine, start with Swing Trading Alongside Your Job. If you are considering a focused trading window, read Learning Day Trading: Which Path Fits?. Both are starting points for learning and review, not promises of suitability.

Lab of Trades
Semi-automated trading systems
Lab of Trades runs ready-made, rules-based trading systems at your broker account. The software monitors the market and prepares the order. You decide whether to execute it with a click.
Explore Lab of Trades
Common questions
Is swing trading always better for people with a job?

No. A scheduled routine may fit around work, but open positions, learning and risk management still take time.

Is day trading safer because positions do not stay open overnight?

No. Avoiding a planned overnight position does not remove market, execution or loss risk during the session.

Is options trading its own trading style?

Options are instruments with an expiration date and contractual rights or obligations. They can be used within different styles.

What return can I expect?

A trading style alone cannot establish your personal return. Assess the method, costs, risks and evidence without a profit promise.

Simon Reichert
Simon Reichert
TradeNeon
Simon Reichert contributes market analysis and trading education at TradeNeon.
What Is Slippage in Trading?

What Is Slippage in Trading?

A startled trader looks at a downward gap in a candlestick chart.
TradingPractical guide

What is slippage
in trading?

You place a trade and a stop order. When the stop triggers, the actual loss is greater than planned. How can that happen, and what should you consider when choosing an order?

A chart gap can contribute to slippage. The decisive difference is between the expected and actual fill price.Image: TradeNeon

The price can jump.
Your fill follows the market.
Understand execution differences, order types and the limits of a stop plan.
Show contents

Imagine this: you spot an attractive trading setup, place your entry order and then a stop order, perhaps also a target order. The trade is opened. Now you wait.

Then a notification arrives: your stop has triggered. The actual loss is higher than the amount you calculated when placing the order. How could that happen? One possible cause is slippageSlippage is the difference between an order's expected execution price and the price actually received. Fees are separate trading costs.. This article explains when it arises and how to account for the risk when choosing an order.

The essential point

With a standard stop-market order, the stop price is a trigger, not a guaranteed fill price. A limit order sets a price boundary but may remain unfilled. Slippage can also work in your favour.

01

What is slippage?

Slippage is the difference between an order's expected execution price and the price actually received. You click buy or sell, but the execution price differs from the one you expected. Buying at €101 rather than the expected €100 is unfavourable; buying at €99 is favourable. For a sale, the assessment reverses.

The difference can occur with market orders and triggered stop-market orders. A displayed quote is no promise for your next order. A wide spread and fees also affect your result, but they are distinct from the difference between expected and actual execution price.

Execution first

Market orderA market order seeks execution at the next available market price. Its final fill may differ from the last price you saw.

You ask to buy or sell at the next available price. If little opposing volume is available, the order may reach several price levels. You do not set a fixed price.

Price boundary first

Limit orderA buy limit executes only at the limit price or lower; a sell limit only at the limit price or higher. Execution is not guaranteed.

You set the most you will pay to buy or the least you will accept to sell. The fill can be better for you, but the order may also remain open.

Trigger before execution

Stop orderA standard stop-market order becomes a market order when its stop price is reached. The stop price does not guarantee the execution price.

A stop can protect an existing position or trigger an entry. A standard stop-market order becomes a market order after triggering. A stop-limit activates a limit order instead and may remain unfilled.

Check your broker's rules for its stop variants and trigger conditions. FINRA explains the order types and their different risks.

02

When does slippage occur?

Slippage becomes more likely when prices move fast or few opposing orders are available. If many market orders or triggered stops meet limited liquidity at the same time, they may pass through several price levels in the order book. Traders often call this rapid consumption of available orders a sweep. High volatilityVolatility describes how much the price of a market or security fluctuates over a given period. It measures the size of price moves, not their direction. and low market liquidityMarket liquidity describes how easily an instrument can be traded without one order moving its price sharply. can amplify it.

Four trading situations make the risk concrete:

  • Triggered stop orders: Once triggered, a standard stop-market order seeks the next available price. In a fast market, the fill may be far from the stop price.
  • News events: Central bank decisions and economic data can trigger many orders at once. The direction and size of the move are unknown in advance.
  • Breakouts and stop runs: Orders may cluster around notable highs and lows. When the level trades, the market can move through several price levels quickly.
  • Large limit orders: If visible liquidity at one price is used up, subsequent order volume may meet the next price level instead.

A gapA gap is a visible discontinuity between two consecutive traded price areas on a chart. is a visible price discontinuity on a chart. If your stop lies in the skipped area, the next available execution price may be beyond it. A gap can cause slippage; slippage can also occur without a gap.

03

How can you limit the risk?

Your order choice and preparation can help limit unwanted price differences. They cannot eliminate slippage altogether.

  1. Consider a limit on entry: If filled, a limit prevents a price worse than your boundary. If the market never reaches it, you do not enter. With a protective stop-limit, remaining in the position can be the greater risk.
  2. Watch liquidity: Check the spread, trading hours and available opposing orders. Even usually liquid markets can become thin after news or outside main trading hours.
  3. Assess notable price levels: Daily and weekly highs and lows, or areas where many stops may sit, can coincide with fast moves. You can watch these areas but cannot reliably predict the move or your fill.
  4. Use a news calendar: Scheduled releases are known; the market reaction is not. Decide in advance whether to trade and what position size you can bear during that period.

Do not move a stop solely because you think fewer other orders are clustered elsewhere. Its level must fit your trade idea and a loss you can bear. A stop-market order is not a fixed cap on losses.

04

What does this mean for your loss plan?

You buy 100 units at €105 and set a stop at €100. The planned price loss is €500, plus costs. After a news release, the market opens at €98 and the triggered stop-market order fills there. The price loss is now €700. The extra €200 is the difference from the stop plan. This is an illustration, not a typical fill.

Entry€105
Planned stop€100
Actual sale€98
Extra price difference€2 × 100 = €200

For futures, options and leveraged products, contract value and product-specific risks also matter. The position-size calculator helps you check the planned distance and position size; it cannot rule out a worse actual fill.

05

Accept or avoid slippage?

Slippage is one of the risks of order execution. You can weigh execution probability against a price boundary, prefer liquid trading hours and account for scheduled news. None of this promises a particular fill.

Record the expected price, actual fill and market conditions for your trades. This can show whether your execution assumptions were too optimistic. Plan a position size that you can bear even if the fill is worse than expected.

Check risk before the click
What position fits your stop?
The calculator shows the planned position size for your chosen stop distance. Also consider how a worse fill would affect your account.
Calculate position size
Common questions
Is slippage always a loss?

No. The actual price can be better or worse for your order. Whether that is favourable depends on the direction of your trade and the market move.

Does a limit order eliminate slippage completely?

If filled, it prevents a price worse than your limit. It does not guarantee a fill; an open position or missed entry may pose the greater risk.

Is a price gap the same as slippage?

No. A gap is a discontinuity visible on a chart. Slippage is the difference between an expected and an actual fill price. A gap can contribute to slippage.

Does a stop guarantee my maximum loss?

A standard stop-market order does not guarantee the stop price as a fill. Fast markets and gaps can move the actual execution price beyond it.

Simon Reichert
Simon Reichert
TradeNeon
Simon Reichert works on market analysis and trading education at TradeNeon.